Frontier Communications 2009 Annual Report Download - page 51
Download and view the complete annual report
Please find page 51 of the 2009 Frontier Communications annual report below. You can navigate through the pages in the report by either clicking on the pages listed below, or by using the keyword search tool below to find specific information within the annual report.-
 1
1 -
2
-
3
-
4
-
5
-
6
-
7
-
8
-
9
-
10
-
11
-
12
-
13
-
14
-
15
-
16
-
17
-
18
-
19
-
20
-
21
-
22
-
23
-
24
-
25
-
26
-
27
-
28
-
29
-
30
-
31
-
32
-
33
-
34
-
35
-
36
-
37
-
38
-
39
-
40
-
 41
41 -
 42
42 -
 43
43 -
 44
44 -
 45
45 -
 46
46 -
 47
47 -
 48
48 -
 49
49 -
 50
50 -
 51
51 -
 52
52 -
 53
53 -
 54
54 -
 55
55 -
 56
56 -
 57
57 -
 58
58 -
 59
59 -
 60
60 -
 61
61 -
62
-
63
-
64
-
65
-
66
-
67
-
68
-
69
-
70
-
71
-
72
-
73
-
74
-
75
-
76
-
77
-
78
-
79
-
80
-
81
-
82
-
83
-
84
-
85
-
86
-
87
-
88
-
89
-
90
-
91
-
92
-
93
-
94
-
95
-
96
-
97
-
98
-
99
-
100
-
101
-
102
-
103
-
104
-
105
-
106
-
107
 |
 |

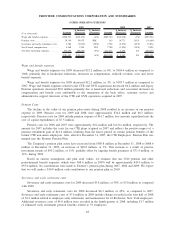
Severance and early retirement costs of $13.9 million in 2007 include a third quarter charge of
approximately $12.1 million related to initiatives to enhance customer service, streamline operations and reduce
costs. Approximately 120 positions were eliminated as part of this 2007 initiative, most of which were filled by
new employees at our remaining call centers. In addition, approximately 50 field operations employees agreed
to participate in an early retirement program and another 30 employees from a variety of functions left the
Company in 2007.
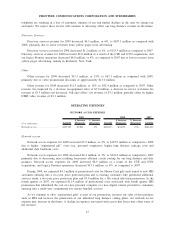
Stock based compensation
Stock based compensation for 2009 increased $1.6 million, or 20%, to $9.4 million as compared with
2008, due to increased costs for restricted stock awards.
Stock based compensation for 2008 decreased $1.2 million, or 14%, as compared to 2007 due to reduced
costs associated with stock units and stock options.
All other operating expenses
All other operating expenses for 2009 decreased $38.3 million, or 9%, to $373.2 million as compared to
2008, due to reduced costs for outside contractors and other vendors, as well as lower fuel, travel and USF
surcharges, partially offset by slightly higher marketing expenses.
All other operating expenses for 2008 increased $7.2 million, or 2%, to $411.5 million as compared to
2007, primarily due to the additional expenses attributable to the CTE and GVN acquisitions of $10.0 million
in 2008 versus 2007, as 2008 includes a full year of expenses for CTE and GVN while 2007 included
approximately ten months of costs for CTE and two months of costs for GVN. Our purchase of CTE has
enabled us to realize cost savings by leveraging our centralized back office, customer service and
administrative support functions over a larger customer base.
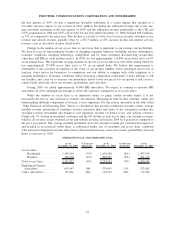
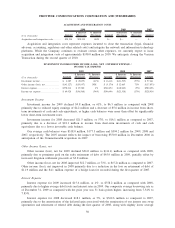
DEPRECIATION AND AMORTIZATION EXPENSE
($ in thousands) Amount
$ Increase
(Decrease)
% Increase
(Decrease) Amount
$ Increase
(Decrease)
% Increase
(Decrease) Amount
2009 2008 2007
Depreciation expense . . . . . . . . . . . . . . . . . $362,228 $(17,262) (5%) $379,490 $ 5,055 1% $374,435
Amortization expense . . . . . . . . . . . . . . . . 114,163 (68,148) (37%) 182,311 10,890 6% 171,421
$476,391 $(85,410) (15%) $561,801 $15,945 3% $545,856
Depreciation and amortization expense for 2009 decreased $85.4 million, or 15%, to $476.4 million as
compared to 2008. The decrease is primarily due to reduced amortization expense, as discussed below, and a
declining net asset base, partially offset by changes in the remaining useful lives of certain assets. An
independent study updating the estimated remaining useful lives of our plant assets is performed annually. We
revised our useful lives based on the study effective October 1, 2009. Our “composite depreciation rate”
decreased from 5.6% to 5.2% as a result of the study. We anticipate depreciation expense of approximately
$335.0 million to $355.0 million and amortization expense of approximately $56.2 million for 2010 related to
our currently owned properties.
Amortization expense for 2009 is comprised of $57.9 million for amortization associated with our legacy
Frontier properties, which were fully amortized in June 2009, and $56.3 million for intangible assets (customer
base and trade name) that were acquired in the Commonwealth and Global Valley acquisitions. Amortization
expense for our legacy Frontier properties was $126.4 million for 2008 and 2007.
Depreciation and amortization expense for 2008 increased $15.9 million, or 3%, to $561.8 million as
compared to 2007. Depreciation and amortization expense increased $26.6 million as a result of the CTE and
GVN acquisitions, and decreased $10.7 million, or 2%, as compared to 2007, primarily due to a declining net
asset base for our legacy Frontier properties, partially offset by changes in the remaining useful lives of certain
assets.
49
FRONTIER COMMUNICATIONS CORPORATION AND SUBSIDIARIES