Frontier Communications 2009 Annual Report Download - page 53
Download and view the complete annual report
Please find page 53 of the 2009 Frontier Communications annual report below. You can navigate through the pages in the report by either clicking on the pages listed below, or by using the keyword search tool below to find specific information within the annual report.-
 1
1 -
2
-
3
-
4
-
5
-
6
-
7
-
8
-
9
-
10
-
11
-
12
-
13
-
14
-
15
-
16
-
17
-
18
-
19
-
20
-
21
-
22
-
23
-
24
-
25
-
26
-
27
-
28
-
29
-
30
-
31
-
32
-
33
-
34
-
35
-
36
-
37
-
38
-
39
-
40
-
41
-
42
-
 43
43 -
 44
44 -
 45
45 -
 46
46 -
 47
47 -
 48
48 -
 49
49 -
 50
50 -
 51
51 -
 52
52 -
 53
53 -
 54
54 -
 55
55 -
 56
56 -
 57
57 -
 58
58 -
 59
59 -
 60
60 -
 61
61 -
 62
62 -
 63
63 -
64
-
65
-
66
-
67
-
68
-
69
-
70
-
71
-
72
-
73
-
74
-
75
-
76
-
77
-
78
-
79
-
80
-
81
-
82
-
83
-
84
-
85
-
86
-
87
-
88
-
89
-
90
-
91
-
92
-
93
-
94
-
95
-
96
-
97
-
98
-
99
-
100
-
101
-
102
-
103
-
104
-
105
-
106
-
107
 |
 |

debt levels and average interest rates. Our composite average borrowing rate as of December 31, 2008, as
compared to 2007, was 40 basis points lower, decreasing from 7.94% to 7.54%.
Our average debt outstanding was $4,867.2 million, $4,753.0 million and $4,834.5 million for 2009, 2008
and 2007, respectively. The higher average debt levels for 2009 result primarily from our April 2009 debt
offering of $600.0 million, as the net proceeds were not fully utilized to retire existing debt until the fourth
quarter of 2009.
Income Tax Expense
Income tax expense for 2009 decreased $36.6 million, or 34%, to $69.9 million as compared with 2008,
primarily due to lower taxable income arising from lower operating income, lower investment income and loss
on debt repurchases. The second quarter of 2008 included a reduction in income tax expense of $7.5 million
that resulted from the expiration of certain statute of limitations on April 15, 2008, as discussed below.
The effective tax rate for 2009 was 36.2% as compared with 36.6% for 2008 and 37.2% for 2007.
Cash paid for taxes was $59.7 million, $78.9 million and $54.4 million in 2009, 2008 and 2007,
respectively. Our 2009 cash taxes were lower than 2008 and reflect the benefits from accelerated tax
depreciation arising from the ARRA, utilization of AMT credits and higher interest expense arising from our
debt offerings not fully offset by debt repurchases. We expect that in 2010 our cash taxes will be less than
$10.0 million. We expect that our 2010 cash taxes will be reduced by the receipt of tax refunds arising from the
retroactive application of a change in tax accounting for repairs and maintenance costs. In addition, our 2010
cash taxes will be impacted by approximately $60.0 million of tax benefits arising from our integration
activities and secondarily, our 2009 debt refinancing activities. Absent the tax benefits generated by these
integration and refinancing activities, we estimate that cash taxes would be approximately $60.0 million to
$70.0 million in 2010.
Refunds of approximately $56.2 million have been applied for in the Company’s 2008 tax returns. The
refunds result from a tax methods change applied for during the third quarter of 2009. Refunds are recorded on
our balance sheet at December 31, 2009 in current assets within income taxes. We recorded approximately $8.2
million (net) related to uncertain tax positions under FASB Interpretation No. (FIN) 48 (ASC Topic 740) in
2009.
Income tax expense for 2008 decreased $21.5 million, or 17%, as compared to 2007, primarily due to
lower taxable income and the reduction in income tax expense of $7.5 million recorded in the second quarter of
2008 that resulted from the expiration of certain statute of limitations on April 15, 2008, as discussed below.
As a result of the expiration of certain statute of limitations on April 15, 2008, the liabilities on our books
as of December 31, 2007 related to uncertain tax positions recorded under FASB Interpretation No. (FIN) 48
(ASC Topic 740) were reduced by $16.2 million in the second quarter of 2008. This reduction lowered income
tax expense by $7.5 million, goodwill by $3.0 million and deferred income tax assets by $5.7 million during the
second quarter of 2008.
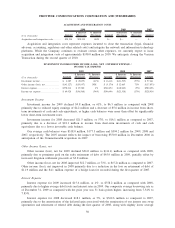
INCOME ATTRIBUTABLE TO THE NONCONTROLLING INTEREST IN A PARTNERSHIP
($ in thousands) Amount
$ Increase
(Decrease)
% Increase
(Decrease) Amount
$ Increase
(Decrease)
% Increase
(Decrease) Amount
2009 2008 2007
Income attributable to the
noncontrolling interest in a
partnership . . . . . . . . . . . . . ............. $2,398 $784 49% $1,614 $(246) (13%) $1,860
Income attributable to the noncontrolling interest relates to our joint venture, Mohave Cellular LP.
51
FRONTIER COMMUNICATIONS CORPORATION AND SUBSIDIARIES