Frontier Communications 2009 Annual Report Download - page 71
Download and view the complete annual report
Please find page 71 of the 2009 Frontier Communications annual report below. You can navigate through the pages in the report by either clicking on the pages listed below, or by using the keyword search tool below to find specific information within the annual report.-
 1
1 -
2
-
3
-
4
-
5
-
6
-
7
-
8
-
9
-
10
-
11
-
12
-
13
-
14
-
15
-
16
-
17
-
18
-
19
-
20
-
21
-
22
-
23
-
24
-
25
-
26
-
27
-
28
-
29
-
30
-
31
-
32
-
33
-
34
-
35
-
36
-
37
-
38
-
39
-
40
-
41
-
42
-
43
-
44
-
45
-
46
-
47
-
48
-
49
-
50
-
51
-
52
-
53
-
54
-
55
-
56
-
57
-
58
-
59
-
60
-
 61
61 -
 62
62 -
 63
63 -
 64
64 -
 65
65 -
 66
66 -
 67
67 -
 68
68 -
 69
69 -
 70
70 -
 71
71 -
 72
72 -
 73
73 -
 74
74 -
 75
75 -
 76
76 -
 77
77 -
 78
78 -
 79
79 -
 80
80 -
 81
81 -
82
-
83
-
84
-
85
-
86
-
87
-
88
-
89
-
90
-
91
-
92
-
93
-
94
-
95
-
96
-
97
-
98
-
99
-
100
-
101
-
102
-
103
-
104
-
105
-
106
-
107
 |
 |

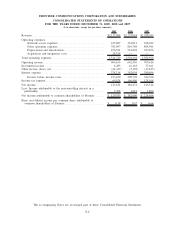
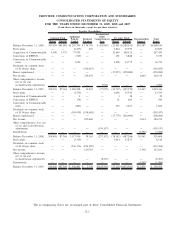
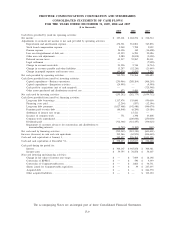
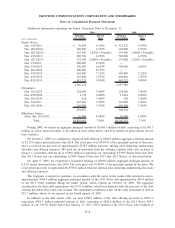
FRONTIER COMMUNICATIONS CORPORATION AND SUBSIDIARIES
CONSOLIDATED STATEMENTS OF CASH FLOWS
FOR THE YEARS ENDED DECEMBER 31, 2009, 2008 and 2007
($ in thousands)
2009 2008 2007
Cash flows provided by (used in) operating activities:
Net income . . . . . . . . . . . . . . . . . . . . . . . . . . . . . . . . . . . . . . . . . . . . . . . . . . . . . . . . . . . . . . . . . . . . . . $ 123,181 $ 184,274 $ 216,514
Adjustments to reconcile net income to net cash provided by operating activities:
Depreciation and amortization expense . . . . . . . . . . . . . . . . . . . . . . . . . . . . . . . . . . . . . . . . 476,391 561,801 545,856
Stock based compensation expense. . . . . . . . . . . . . . . . . . . . . . . . . . . . . . . . . . . . . . . . . . . . 9,368 7,788 9,022
Pension expense . . . . . . . . . . . . . . . . . . . . . . . . . . . . . . . . . . . . . . . . . . . . . . . . . . . . . . . . . . . . . 34,196 163 (14,608)
Loss on extinguishment of debt, net . . . . . . . . . . . . . . . . . . . . . . . . . . . . . . . . . . . . . . . . . . 45,939 6,290 20,186
Other non-cash adjustments. . . . . . . . . . . . . . . . . . . . . . . . . . . . . . . . . . . . . . . . . . . . . . . . . . . 2,080 (8,658) (9,458)
Deferred income taxes . . . . . . . . . . . . . . . . . . . . . . . . . . . . . . . . . . . . . . . . . . . . . . . . . . . . . . . 61,217 33,967 81,011
Legal settlement . . . . . . . . . . . . . . . . . . . . . . . . . . . . . . . . . . . . . . . . . . . . . . . . . . . . . . . . . . . . . — — (7,905)
Change in accounts receivable . . . . . . . . . . . . . . . . . . . . . . . . . . . . . . . . . . . . . . . . . . . . . . . . 21,906 9,746 (4,714)
Change in accounts payable and other liabilities . . . . . . . . . . . . . . . . . . . . . . . . . . . . . . . 13,297 (52,210) (21,649)
Change in prepaid expenses and income taxes . . . . . . . . . . . . . . . . . . . . . . . . . . . . . . . . . (44,855) (3,895) 7,428
Net cash provided by operating activities . . . . . . . . . . . . . . . . . . . . . . . . . . . . . . . . . . . . . . . . . . 742,720 739,266 821,683
Cash flows provided from (used by) investing activities:
Capital expenditures—Business operations. . . . . . . . . . . . . . . . . . . . . . . . . . . . . . . . . . . . . (230,966) (288,264) (306,203)
Capital expenditures—Integration activities . . . . . . . . . . . . . . . . . . . . . . . . . . . . . . . . . . . . (24,999) — (9,590)
Cash paid for acquisitions (net of cash acquired) . . . . . . . . . . . . . . . . . . . . . . . . . . . . . . — — (725,548)
Other assets purchased and distributions received, net. . . . . . . . . . . . . . . . . . . . . . . . . . 673 5,489 6,629
Net cash used by investing activities . . . . . . . . . . . . . . . . . . . . . . . . . . . . . . . . . . . . . . . . . . . . . . (255,292) (282,775) (1,034,712)
Cash flows provided from (used by) financing activities:
Long-term debt borrowings. . . . . . . . . . . . . . . . . . . . . . . . . . . . . . . . . . . . . . . . . . . . . . . . . . . 1,117,476 135,000 950,000
Financing costs paid . . . . . . . . . . . . . . . . . . . . . . . . . . . . . . . . . . . . . . . . . . . . . . . . . . . . . . . . . (2,204) (857) (12,196)
Long-term debt payments . . . . . . . . . . . . . . . . . . . . . . . . . . . . . . . . . . . . . . . . . . . . . . . . . . . . (1,027,408) (142,480) (946,070)
Premium paid to retire debt . . . . . . . . . . . . . . . . . . . . . . . . . . . . . . . . . . . . . . . . . . . . . . . . . . (66,868) (6,290) (20,186)
Settlement of interest rate swaps. . . . . . . . . . . . . . . . . . . . . . . . . . . . . . . . . . . . . . . . . . . . . . — 15,521 —
Issuance of common stock . . . . . . . . . . . . . . . . . . . . . . . . . . . . . . . . . . . . . . . . . . . . . . . . . . . 751 1,398 13,808
Common stock repurchased. . . . . . . . . . . . . . . . . . . . . . . . . . . . . . . . . . . . . . . . . . . . . . . . . . . — (200,000) (250,000)
Dividends paid . . . . . . . . . . . . . . . . . . . . . . . . . . . . . . . . . . . . . . . . . . . . . . . . . . . . . . . . . . . . . . (312,366) (318,437) (336,025)
Repayment of customer advances for construction and distributions to
noncontrolling interests . . . . . . . . . . . . . . . . . . . . . . . . . . . . . . . . . . . . . . . . . . . . . . . . . . . . (1,743) (3,185) (942)
Net cash used by financing activities . . . . . . . . . . . . . . . . . . . . . . . . . . . . . . . . . . . . . . . . . . . . . . (292,362) (519,330) (601,611)
Increase (decrease) in cash and cash equivalents . . . . . . . . . . . . . . . . . . . . . . . . . . . . . . . . . . . 195,066 (62,839) (814,640)
Cash and cash equivalents at January 1, . . . . . . . . . . . . . . . . . . . . . . . . . . . . . . . . . . . . . . . . . . . 163,627 226,466 1,041,106
Cash and cash equivalents at December 31,. . . . . . . . . . . . . . . . . . . . . . . . . . . . . . . . . . . . . . . . $ 358,693 $ 163,627 $ 226,466
Cash paid during the period for:
Interest . . . . . . . . . . . . . . . . . . . . . . . . . . . . . . . . . . . . . . . . . . . . . . . . . . . . . . . . . . . . . . . . . . . . . . $ 364,167 $ 365,858 $ 364,381
Income taxes . . . . . . . . . . . . . . . . . . . . . . . . . . . . . . . . . . . . . . . . . . . . . . . . . . . . . . . . . . . . . . . . $ 59,735 $ 78,878 $ 54,407
Non-cash investing and financing activities:
Change in fair value of interest rate swaps . . . . . . . . . . . . . . . . . . . . . . . . . . . . . . . . . . . . $ — $ 7,909 $ 18,198
Conversion of EPPICS . . . . . . . . . . . . . . . . . . . . . . . . . . . . . . . . . . . . . . . . . . . . . . . . . . . . . . . $ — $ 590 $ 3,339
Conversion of Commonwealth notes . . . . . . . . . . . . . . . . . . . . . . . . . . . . . . . . . . . . . . . . . . $ — $ 1,666 $ 36,731
Shares issued for Commonwealth acquisition . . . . . . . . . . . . . . . . . . . . . . . . . . . . . . . . . . $ — $ 39 $ 247,435
Acquired debt . . . . . . . . . . . . . . . . . . . . . . . . . . . . . . . . . . . . . . . . . . . . . . . . . . . . . . . . . . . . . . . $ — $ — $ 244,570
Other acquired liabilities . . . . . . . . . . . . . . . . . . . . . . . . . . . . . . . . . . . . . . . . . . . . . . . . . . . . . $ — $ — $ 112,194
The accompanying Notes are an integral part of these Consolidated Financial Statements.
F-9