Frontier Communications 2009 Annual Report Download - page 46
Download and view the complete annual report
Please find page 46 of the 2009 Frontier Communications annual report below. You can navigate through the pages in the report by either clicking on the pages listed below, or by using the keyword search tool below to find specific information within the annual report.-
 1
1 -
2
-
3
-
4
-
5
-
6
-
7
-
8
-
9
-
10
-
11
-
12
-
13
-
14
-
15
-
16
-
17
-
18
-
19
-
20
-
21
-
22
-
23
-
24
-
25
-
26
-
27
-
28
-
29
-
30
-
31
-
32
-
33
-
34
-
35
-
 36
36 -
 37
37 -
 38
38 -
 39
39 -
 40
40 -
 41
41 -
 42
42 -
 43
43 -
 44
44 -
 45
45 -
 46
46 -
 47
47 -
 48
48 -
 49
49 -
 50
50 -
 51
51 -
 52
52 -
 53
53 -
 54
54 -
 55
55 -
 56
56 -
57
-
58
-
59
-
60
-
61
-
62
-
63
-
64
-
65
-
66
-
67
-
68
-
69
-
70
-
71
-
72
-
73
-
74
-
75
-
76
-
77
-
78
-
79
-
80
-
81
-
82
-
83
-
84
-
85
-
86
-
87
-
88
-
89
-
90
-
91
-
92
-
93
-
94
-
95
-
96
-
97
-
98
-
99
-
100
-
101
-
102
-
103
-
104
-
105
-
106
-
107
 |
 |

2009
$ Increase
(Decrease)
% Increase
(Decrease) 2008
$ Increase
(Decrease)
% Increase
(Decrease) 2007
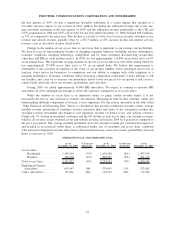
For the year ended December 31,
Revenue (in 000’s):
Residential.......... $ 899,800 $ (49,484) (5%) $ 949,284 $ (9,169) (1%) $ 958,453
Business ............ 858,460 (24,561) (3%) 883,021 32,921 4% 850,100
Total customer revenue . . 1,758,260 (74,045) (4%) 1,832,305 23,752 1% 1,808,553
Regulatory (Access
Services) . . ............ 359,634 (45,079) (11%) 404,713 (74,749) (16%) 479,462
Total revenue............ $2,117,894 $(119,124) (5%) $2,237,018 $(50,997) (2%) $2,288,015
Switched access minutes
of use (in millions) . . . . 8,854 (12%) 10,027 (5%) 10,592
Average monthly total
revenue per access
line ................... $ 80.74 1% $ 79.62 2% $ 77.72(1)
Average monthly
customer revenue per
access line ............ $ 67.03 3% $ 65.22 4% $ 62.49
As of
December 31, 2009
As of
December 31, 2008
Residential Customer Metrics:
Customers . . . ............... 1,254,508 (7%) 1,347,423
Revenue (in 000’s) .......... $ 899,800 (5%) $ 949,284
Average Monthly Residential
Customer Revenue per
Customer . . ............... $ 57.62 2% $ 56.42
Percent of Customers on
Price Protection Plans ..... 53.2% 19% 44.6%
Customer Monthly Churn .... 1.47% (6%) 1.57%
Products per Residential
Customer(2) ............... 2.54 7% 2.37
(1) For the year ended December 31, 2007, the calculation includes CTE and GVN data and excludes the $38.7
million favorable one-time impact from the first quarter 2007 settlement of a switched access dispute. The
amount is $79.06 with the $38.7 million favorable one-time impact from the settlement.
(2) Products per Residential Customer: Primary Residential Voice line, HSI, Video products have a value of 1.
FTR long distance, POM, second lines, Feature Packages and Dial-up have a value of 0.5.
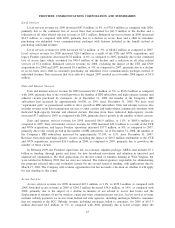
REVENUE
($ in thousands) Amount
$ Increase
(Decrease)
% Increase
(Decrease) Amount
$ Increase
(Decrease)
% Increase
(Decrease) Amount
2009 2008 2007
Local services . . . . . . . . . . . . . . . . . . $ 781,388 $ (67,005) (8%) $ 848,393 $(27,369) (3%) $ 875,762
Data and internet services . . . . . . . 636,943 31,328 5% 605,615 61,851 11% 543,764
Access services . . . . . . . . . . . . . . . . . 359,634 (45,079) (11%) 404,713 (74,749) (16%) 479,462
Long distance services . . . . . . . . . . 165,774 (16,785) (9%) 182,559 2,034 1% 180,525
Directory services . . . . . . . . . . . . . . . 107,096 (6,251) (6%) 113,347 (1,239) (1%) 114,586
Other. . . . . . . .................... 67,059 (15,332) (19%) 82,391 (11,525) (12%) 93,916
$2,117,894 $(119,124) (5%) $2,237,018 $(50,997) (2%) $2,288,015
44
FRONTIER COMMUNICATIONS CORPORATION AND SUBSIDIARIES