Frontier Communications 2009 Annual Report Download - page 45
Download and view the complete annual report
Please find page 45 of the 2009 Frontier Communications annual report below. You can navigate through the pages in the report by either clicking on the pages listed below, or by using the keyword search tool below to find specific information within the annual report.-
 1
1 -
2
-
3
-
4
-
5
-
6
-
7
-
8
-
9
-
10
-
11
-
12
-
13
-
14
-
15
-
16
-
17
-
18
-
19
-
20
-
21
-
22
-
23
-
24
-
25
-
26
-
27
-
28
-
29
-
30
-
31
-
32
-
33
-
34
-
 35
35 -
 36
36 -
 37
37 -
 38
38 -
 39
39 -
 40
40 -
 41
41 -
 42
42 -
 43
43 -
 44
44 -
 45
45 -
 46
46 -
 47
47 -
 48
48 -
 49
49 -
 50
50 -
 51
51 -
 52
52 -
 53
53 -
 54
54 -
 55
55 -
56
-
57
-
58
-
59
-
60
-
61
-
62
-
63
-
64
-
65
-
66
-
67
-
68
-
69
-
70
-
71
-
72
-
73
-
74
-
75
-
76
-
77
-
78
-
79
-
80
-
81
-
82
-
83
-
84
-
85
-
86
-
87
-
88
-
89
-
90
-
91
-
92
-
93
-
94
-
95
-
96
-
97
-
98
-
99
-
100
-
101
-
102
-
103
-
104
-
105
-
106
-
107
 |
 |

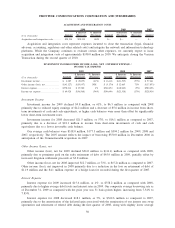
the first quarter of 2007, we had a significant favorable settlement of a carrier dispute that resulted in a
favorable one-time impact to our revenue of $38.7 million. Excluding the additional revenue due to the one-
time favorable settlement in the first quarter of 2007 and the additional revenue attributable to the CTE and
GVN acquisitions in 2008 and 2007, our revenue for the year ended December 31, 2008 declined $68.6 million,
or 3%, as compared to the prior year. This decline is a result of lower local services revenue, switched access
revenue and subsidy revenue, partially offset by a $37.3 million, or 8%, increase in data and internet services
revenue, each as described in more detail below.
Change in the number of our access lines is one factor that is important to our revenue and profitability.
We have lost access lines primarily because of changing consumer behavior (including wireless substitution),
economic conditions, changing technology, competition, and by some customers disconnecting second lines
when they add HSI or cable modem service. In 2009, we lost approximately 136,800 access lines (net), or 6%
on an annual basis. This represents an improvement in our rate of access line loss over 2008, during which we
lost approximately 174,800 access lines (net) or 7% on an annual basis. We believe this improvement is
attributable to the customer recognition of the value of our product bundles, fewer residential moves out of
territory, fewer moves by businesses to competitors and our ability to compete with cable telephony in a
maturing marketplace. Economic conditions and/or increasing competition could make it more difficult to sell
our bundles, and cause us to increase our promotions and/or lower our prices for our products and services,
which would adversely affect our revenue, profitability and cash flow.
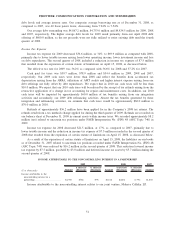
During 2009, we added approximately 56,000 HSI subscribers. We expect to continue to increase HSI
subscribers in 2010 (although not enough to offset the expected continued loss in access lines).
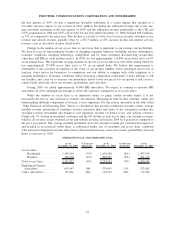
While the number of access lines is an important metric to gauge certain revenue trends, it is not
necessarily the best or only measure to evaluate our business. Management believes that customer counts and
understanding different components of revenue is most important. For this reason, presented in the table titled
“Other Financial and Operating Data” below is a breakdown that presents residential customer counts, average
monthly revenue, percentage of customers on price protection plans and churn. It also categorizes revenue into
customer revenue (residential and business) and regulatory revenue (switched access and subsidy revenue).
Despite the 7% decline in residential customers and the 6% decline in total access lines, our customer revenue,
which is all revenue except switched access and subsidy revenue, declined in 2009 by 4 percent as compared to
the prior year period. The average monthly residential and total customer revenue per customer has improved,
and resulted in an increased wallet share. A substantial further loss of customers and access lines, combined
with increased competition and the other factors discussed herein may cause our revenue, profitability and cash
flows to decrease in 2010.
As of
December 31, 2009
% Increase
(Decrease)
As of
December 31, 2008
% Increase
(Decrease)
As of
December 31, 2007
OTHER FINANCIAL AND OPERATING DATA
Access lines:
Residential ........... 1,349,510 (7%) 1,454,268 (8%) 1,587,930
Business ............. 768,002 (4%) 800,065 (5%) 841,212
Total access lines ......... 2,117,512 (6%) 2,254,333 (7%) 2,429,142
High-Speed Internet
subscribers.............. 635,947 10% 579,943 11% 522,845
Video subscribers ......... 172,961 44% 119,919 28% 93,596
43
FRONTIER COMMUNICATIONS CORPORATION AND SUBSIDIARIES