DIRECTV 2012 Annual Report Download - page 71
Download and view the complete annual report
Please find page 71 of the 2012 DIRECTV annual report below. You can navigate through the pages in the report by either clicking on the pages listed below, or by using the keyword search tool below to find specific information within the annual report.-
 1
1 -
2
-
3
-
4
-
5
-
6
-
7
-
8
-
9
-
10
-
11
-
12
-
13
-
14
-
15
-
16
-
17
-
18
-
19
-
20
-
21
-
22
-
23
-
24
-
25
-
26
-
27
-
28
-
29
-
30
-
31
-
32
-
33
-
34
-
35
-
36
-
37
-
38
-
39
-
40
-
41
-
42
-
43
-
44
-
45
-
46
-
47
-
48
-
49
-
50
-
51
-
52
-
53
-
54
-
55
-
56
-
57
-
58
-
59
-
60
-
 61
61 -
 62
62 -
 63
63 -
 64
64 -
 65
65 -
 66
66 -
 67
67 -
 68
68 -
 69
69 -
 70
70 -
 71
71 -
 72
72 -
 73
73 -
 74
74 -
 75
75 -
 76
76 -
 77
77 -
 78
78 -
 79
79 -
 80
80 -
 81
81 -
82
-
83
-
84
-
85
-
86
-
87
-
88
-
89
-
90
-
91
-
92
-
93
-
94
-
95
-
96
-
97
-
98
-
99
-
100
-
101
-
102
-
103
-
104
-
105
-
106
-
107
-
108
-
109
-
110
-
111
-
112
-
113
-
114
-
115
-
116
-
117
-
118
-
119
-
120
-
121
-
122
-
123
-
124
-
125
-
126
-
127
-
128
-
129
-
130
-
131
-
132
-
133
-
134
-
135
-
136
-
137
-
138
-
139
-
140
-
141
-
142
-
143
-
144
-
145
-
146
-
147
-
148
-
149
-
150
-
151
-
152
-
153
-
154
 |
 |

DIRECTV
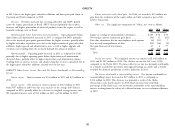
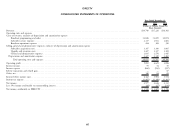
Earnings Per Share At December 31, 2012, our cash and cash equivalents totaled $1,902 million
compared with $873 million at December 31, 2011.
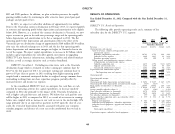
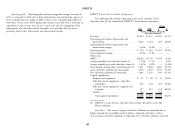
Class A common stock earnings per share and weighted shares outstanding
were as follows for the years ended December 31: As a measure of liquidity, the current ratio (ratio of current assets to current
liabilities) was 1.00 at December 31, 2012 and 0.89 at December 31, 2011.
2011 2010 Working capital increased by $515 million to $13 million at December 31, 2012
(Shares in from a deficit of $502 million at December 31, 2011. The increase during the year
Millions) was primarily due to the increase in cash and cash equivalents, primarily due to an
Basic earnings attributable to DIRECTV Class A common increase in proceeds from the issuance of long-term debt.
stockholders per common share ...................... $3.49 $2.31
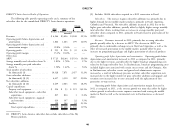
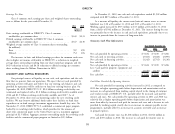
Diluted earnings attributable to DIRECTV Class A common Summary Cash Flow Information
stockholders per common share ...................... $3.47 $2.30
Weighted average number of Class A common shares outstanding Years Ended December 31,
(in millions): 2012 2011 2010
Basic ....................................... 747 870 (Dollars in Millions)
Diluted ...................................... 752 876 Net cash provided by operating activities ....... $5,634 $ 5,185 $ 5,206
Net cash used in investing activities ........... (3,363) (3,022) (3,099)
The increases in basic and diluted earnings per share for common stock were
Net cash used in financing activities ........... (1,242) (2,792) (3,210)
due to higher net income attributable to DIRECTV, a reduction in weighted
Free cash flow:
average shares outstanding resulting from our share repurchase program, and the
Net cash provided by operating activities ....... $5,634 $ 5,185 $ 5,206
$0.19 reduction to basic and $0.18 reduction to diluted earnings per common
Less: Cash paid for property, equipment and
share resulting from the Malone Transaction in 2010.
satellites ........................... (3,349) (3,170) (2,416)
LIQUIDITY AND CAPITAL RESOURCES Free cash flow ......................... $2,285 $ 2,015 $ 2,790
Our principal sources of liquidity are our cash, cash equivalents and the cash
flow that we generate from our operations. We expect that net cash provided by Cash Flows Provided By Operating Activities
operating activities will grow and believe that our existing cash balances and cash Net cash provided by operating activities increased in 2012 as compared to
provided by operations will be sufficient to fund our existing business plan. On 2011 due to higher operating profit before depreciation and amortization and an
September 28, 2012, DIRECTV U.S.’ $2.0 billion revolving credit facility was increases in cash generated from working capital related to the timing of customer
terminated and replaced with a $1.0 billion revolving credit facility available until and vendor receipts at DIRECTV U.S., partially offset by increased cash paid for
2016 and $1.5 billion revolving credit facility available until 2017. As of interest and taxes. Net cash provided by operating activities in 2011 and 2010 was
December 31, 2012, there were no borrowings under the new revolving credit relatively flat as higher operating profit before depreciation and amortization was
facilities. We may borrow additional funds under these facilities to fund share more than offset by increased cash paid for interest and taxes and a decrease in cash
repurchases or to fund strategic investment opportunities should they arise. On provided by working capital, mostly due to an increase in amounts payable to our
November 27, 2012, DIRECTV U.S. established a commercial paper program programmers. partially offset by an increase in accounts receivable and an increase
backed by its revolving credit facilities, which provides for the issuance of in prepaid expenses.
short-term commercial paper in the United States up to a maximum aggregate
principal of $2.5 billion. Aggregate amounts outstanding under the revolving credit Cash paid for income taxes was $1,406 million in 2012, $1,042 million in
facilities and the commercial paper program are limited to $2.5 billion. 2011 and $705 million in 2010. The increase in cash paid for income taxes in
51