DIRECTV 2012 Annual Report Download - page 66
Download and view the complete annual report
Please find page 66 of the 2012 DIRECTV annual report below. You can navigate through the pages in the report by either clicking on the pages listed below, or by using the keyword search tool below to find specific information within the annual report.-
 1
1 -
2
-
3
-
4
-
5
-
6
-
7
-
8
-
9
-
10
-
11
-
12
-
13
-
14
-
15
-
16
-
17
-
18
-
19
-
20
-
21
-
22
-
23
-
24
-
25
-
26
-
27
-
28
-
29
-
30
-
31
-
32
-
33
-
34
-
35
-
36
-
37
-
38
-
39
-
40
-
41
-
42
-
43
-
44
-
45
-
46
-
47
-
48
-
49
-
50
-
51
-
52
-
53
-
54
-
55
-
 56
56 -
 57
57 -
 58
58 -
 59
59 -
 60
60 -
 61
61 -
 62
62 -
 63
63 -
 64
64 -
 65
65 -
 66
66 -
 67
67 -
 68
68 -
 69
69 -
 70
70 -
 71
71 -
 72
72 -
 73
73 -
 74
74 -
 75
75 -
 76
76 -
77
-
78
-
79
-
80
-
81
-
82
-
83
-
84
-
85
-
86
-
87
-
88
-
89
-
90
-
91
-
92
-
93
-
94
-
95
-
96
-
97
-
98
-
99
-
100
-
101
-
102
-
103
-
104
-
105
-
106
-
107
-
108
-
109
-
110
-
111
-
112
-
113
-
114
-
115
-
116
-
117
-
118
-
119
-
120
-
121
-
122
-
123
-
124
-
125
-
126
-
127
-
128
-
129
-
130
-
131
-
132
-
133
-
134
-
135
-
136
-
137
-
138
-
139
-
140
-
141
-
142
-
143
-
144
-
145
-
146
-
147
-
148
-
149
-
150
-
151
-
152
-
153
-
154
 |
 |

DIRECTV
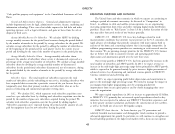
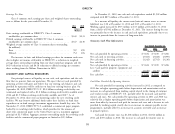
DIRECTV Latin America Results of Operations (2) Excludes 18,000 subscribers acquired in a 2012 transaction in Brazil.
The following table provides operating results and a summary of key Subscribers. The increase in gross subscriber additions was primarily due to
subscriber data for the consolidated DIRECTV Latin America operations: higher demand for our middle market products, primarily in Brazil, Argentina,
Colombia and Venezuela. Net subscriber additions increased in 2012 due to the
Change higher gross subscriber additions, partially offset by slightly higher average monthly
2012 2011 $ % total subscriber churn, resulting from an increase in average monthly post paid
(Dollars in Millions, Except Per Subscriber subscriber churn compared to 2011, primarily in Brazil related to penetration of the
Amounts)
middle market.
Revenues ....................... $ 6,244 $5,096 $1,148 22.5%
Operating profit before depreciation and Revenues. Revenues increased in 2012, primarily due to strong subscriber
amortization .................... 1,862 1,663 199 12.0% growth, partially offset by a decrease in ARPU. The decrease in ARPU was
Operating profit before depreciation and primarily due to unfavorable exchange rates in Brazil and Argentina, as well as the
amortization margin .............. 29.8% 32.6% — — effect of increased penetration in the middle market, partially offset by price
Operating profit ................... $ 955 $ 916 $ 39 4.3% increases on programming packages and higher penetration of advanced products.
Operating profit margin ............. 15.3% 18.0% — —
Other data: Operating profit before depreciation and amortization. Operating profit before
ARPU ......................... $ 57.25 $62.64 $ (5.39) (8.6)% depreciation and amortization increased in 2012 as compared to 2011, primarily
Average monthly total subscriber churn % . 1.81% 1.78% — 1.7% due to the higher revenues, partially offset by higher broadcast programming costs
Average monthly post paid subscriber related to the larger subscriber base. In PanAmericana, broadcast programming costs
churn % ...................... 1.50% 1.42% — 5.6% included higher costs associated with certain soccer events and the Olympics. Also
Total number of subscribers in PanAmericana, subscriber service and general and administrative expenses
(in thousands) (1) ................ 10,328 7,871 2,457 31.2% increased as a result of inflationary pressures on labor, subscriber acquisition costs
Gross subscriber additions increased due to the higher number of gross subscriber additions and upgrade and
(in thousands) (1) (2) ............. 4,417 3,510 907 25.8% retention costs increased due to costs associated with the replacement of first
Net subscriber additions generation set-top receivers.
(in thousands) (1) (2) ............. 2,439 2,063 376 18.2% Operating profit before depreciation and amortization margin decreased in
Capital expenditures: 2012 as compared to 2011, as the revenue growth was more than offset by higher
Property and equipment ............ $ 214 $ 93 $ 121 130.1% relative growth in subscriber service expenses associated with serving the middle
Subscriber leased equipment—subscriber market in Brazil as well as the incremental costs in PanAmericana, as discussed
acquisitions ................... 837 834 3 0.4% above.
Subscriber leased equipment—upgrade
and retention ................. 419 397 22 5.5%
Satellites ...................... 128 104 24 23.1%
Total capital expenditures ......... $ 1,598 $1,428 $ 170 11.9%
(1) DIRECTV Latin America subscriber data exclude subscribers of the Sky
Mexico platform.
46