DIRECTV 2012 Annual Report Download - page 113
Download and view the complete annual report
Please find page 113 of the 2012 DIRECTV annual report below. You can navigate through the pages in the report by either clicking on the pages listed below, or by using the keyword search tool below to find specific information within the annual report.-
 1
1 -
2
-
3
-
4
-
5
-
6
-
7
-
8
-
9
-
10
-
11
-
12
-
13
-
14
-
15
-
16
-
17
-
18
-
19
-
20
-
21
-
22
-
23
-
24
-
25
-
26
-
27
-
28
-
29
-
30
-
31
-
32
-
33
-
34
-
35
-
36
-
37
-
38
-
39
-
40
-
41
-
42
-
43
-
44
-
45
-
46
-
47
-
48
-
49
-
50
-
51
-
52
-
53
-
54
-
55
-
56
-
57
-
58
-
59
-
60
-
61
-
62
-
63
-
64
-
65
-
66
-
67
-
68
-
69
-
70
-
71
-
72
-
73
-
74
-
75
-
76
-
77
-
78
-
79
-
80
-
81
-
82
-
83
-
84
-
85
-
86
-
87
-
88
-
89
-
90
-
91
-
92
-
93
-
94
-
95
-
96
-
97
-
98
-
99
-
100
-
101
-
102
-
 103
103 -
 104
104 -
 105
105 -
 106
106 -
 107
107 -
 108
108 -
 109
109 -
 110
110 -
 111
111 -
 112
112 -
 113
113 -
 114
114 -
 115
115 -
 116
116 -
 117
117 -
 118
118 -
 119
119 -
 120
120 -
 121
121 -
 122
122 -
 123
123 -
124
-
125
-
126
-
127
-
128
-
129
-
130
-
131
-
132
-
133
-
134
-
135
-
136
-
137
-
138
-
139
-
140
-
141
-
142
-
143
-
144
-
145
-
146
-
147
-
148
-
149
-
150
-
151
-
152
-
153
-
154
 |
 |

DIRECTV
NOTES TO THE CONSOLIDATED FINANCIAL STATEMENTS—(continued)
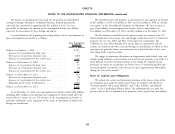
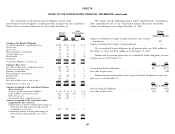
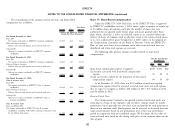
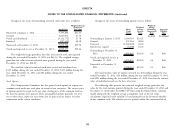
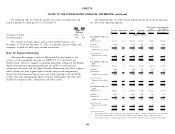
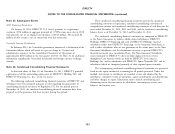
Changes in the status of outstanding restricted stock units were as follows: Changes in the status of outstanding options were as follows:
Weighted-Average Weighted-
Grant-Date Weighted- Average
Stock Units Fair Value Shares Average Remaining Aggregate
Under Exercise Contractual Intrinsic
Nonvested at January 1, 2012 ............... 7,595,892 $31.35 Option Price Term Value
Granted ............................. 2,847,076 41.72 (in years) (in millions)
Vested and distributed .................... (3,122,772) 21.78 Outstanding at January 1, 2012 3,364,510 $23.21
Forfeited ............................. (247,450) 40.38 Granted ................ 995,964 48.18
Exercised ............... (1,260,629) 30.62
Nonvested at December 31, 2012 ............ 7,072,746 $39.50 Forfeited or expired ........ (4,000) 16.23
Vested and expected to vest at December 31, 2012 . 6,819,177 $39.26 Outstanding at December 31,
2012 ................ 3,095,845 $28.24 4.6 $68
The weighted-average grant-date fair value of restricted stock units granted
during the year ended December 31, 2011 was $41.14. The weighted-average Vested and expected to vest at
grant-date fair value of restricted stock units granted during the year ended December 31, 2012 ....... 3,095,845 $28.24 4.6 $68
December 31, 2010 was $30.83. Exercisable at December 31,
The total fair value of restricted stock units vested and distributed was 2012 ................ 2,196,293 $19.93 2.5 $66
$139 million during the year ended December 31, 2012, $125 million during the
The total intrinsic value of options exercised was $26 million during the year
year ended December 31, 2011 and $81 million during the year ended
ended December 31, 2012, $24 million during the year ended December 31, 2011
December 31, 2010.
and $221 million during the year ended December 31, 2010, based on the intrinsic
value of individual awards on the date of exercise.
Stock Options
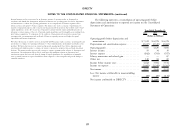
The following table presents the estimated weighted-average grant-date fair
The Compensation Committee has also granted stock options to acquire our
value for the stock options granted during the years ended December 31, 2012 and
common stock under our stock plan to certain of our executives. The exercise price
December 31, 2010 under the DIRECTV Plan using the Black-Scholes valuation
of options granted is equal to the per share closing price of the common stock on
model along with the weighted-average assumptions used in the fair value
the date the options were granted. These nonqualified options generally vest over
calculations. Expected stock volatility is based primarily on the historical volatility
one to three years, expire ten years from date of grant and are subject to earlier
of our common stock. The risk-free rate for periods within the contractual life of
termination under certain conditions.
93