DIRECTV 2012 Annual Report Download - page 68
Download and view the complete annual report
Please find page 68 of the 2012 DIRECTV annual report below. You can navigate through the pages in the report by either clicking on the pages listed below, or by using the keyword search tool below to find specific information within the annual report.-
 1
1 -
2
-
3
-
4
-
5
-
6
-
7
-
8
-
9
-
10
-
11
-
12
-
13
-
14
-
15
-
16
-
17
-
18
-
19
-
20
-
21
-
22
-
23
-
24
-
25
-
26
-
27
-
28
-
29
-
30
-
31
-
32
-
33
-
34
-
35
-
36
-
37
-
38
-
39
-
40
-
41
-
42
-
43
-
44
-
45
-
46
-
47
-
48
-
49
-
50
-
51
-
52
-
53
-
54
-
55
-
56
-
57
-
 58
58 -
 59
59 -
 60
60 -
 61
61 -
 62
62 -
 63
63 -
 64
64 -
 65
65 -
 66
66 -
 67
67 -
 68
68 -
 69
69 -
 70
70 -
 71
71 -
 72
72 -
 73
73 -
 74
74 -
 75
75 -
 76
76 -
 77
77 -
 78
78 -
79
-
80
-
81
-
82
-
83
-
84
-
85
-
86
-
87
-
88
-
89
-
90
-
91
-
92
-
93
-
94
-
95
-
96
-
97
-
98
-
99
-
100
-
101
-
102
-
103
-
104
-
105
-
106
-
107
-
108
-
109
-
110
-
111
-
112
-
113
-
114
-
115
-
116
-
117
-
118
-
119
-
120
-
121
-
122
-
123
-
124
-
125
-
126
-
127
-
128
-
129
-
130
-
131
-
132
-
133
-
134
-
135
-
136
-
137
-
138
-
139
-
140
-
141
-
142
-
143
-
144
-
145
-
146
-
147
-
148
-
149
-
150
-
151
-
152
-
153
-
154
 |
 |

DIRECTV
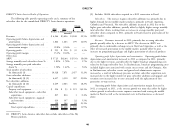
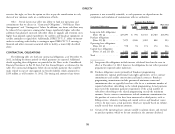
Year Ended December 31, 2011 Compared with the Year Ended December 31, Subscribers. In 2011, net subscriber additions were relatively unchanged as
2010 higher gross additions mainly resulting from improved customer offers were offset
by an increase in the monthly churn rate, which resulted primarily from a more
DIRECTV U.S. Results of Operations competitive environment.
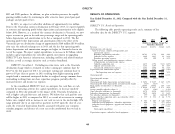
The following table provides operating results and a summary of key Revenues. Our revenues increased as a result of higher ARPU and the larger
subscriber data for the DIRECTV U.S. segment: subscriber base. The increase in ARPU resulted primarily from price increases on
Change programming packages, higher set-top receiver lease fees, higher advanced service
2011 2010 $ % fees, higher premium channel buy rates and an increase in NFL SUNDAY
(Dollars in Millions, Except Per TICKET revenues, partially offset by higher promotional offers to new and existing
Subscriber Amounts) subscribers.
Revenues .................................$21,872 $20,268 $1,604 7.9%
Operating costs and expenses Operating profit before depreciation and amortization. Operating profit before
Costs of revenues, exclusive of depreciation and
amortization expense depreciation and amortization was higher in 2011 as compared to 2010 as increased
Broadcast programming and other ................ 9,799 8,699 1,100 12.6% revenues were partially offset by higher broadcasting programming costs, increased
Subscriber service expenses .................... 1,435 1,340 95 7.1% subscriber acquisition costs and higher upgrade and retention costs. Operating
Broadcast operations expenses ................... 300 273 27 9.9%
Selling, general and administrative expenses, exclusive of profit before depreciation and amortization margin decreased in 2011 as compared
depreciation and amortization expense to 2010 as the revenue growth was more than offset by higher relative growth in
Subscriber acquisition costs .................... 2,794 2,631 163 6.2%
Upgrade and retention costs ................... 1,209 1,106 103 9.3% broadcast programming and other costs.
General and administrative expenses ............... 1,046 1,003 43 4.3%
Depreciation and amortization expense ................ 1,587 1,926 (339) (17.6)% Broadcast programming and other costs increased primarily due to annual
Total operating costs and expenses .............. 18,170 16,978 1,192 7.0% program supplier rate increases, higher costs resulting from our new NFL SUNDAY
Operating profit .............................$3,702 $ 3,290 $ 412 12.5% TICKET contract, which went into effect with the 2011 season and the larger
number of subscribers. Subscriber service expenses increased in 2011 compared to
Operating profit margin ......................... 16.9% 16.2% — —
Other data: 2010 primarily due to service quality improvement initiatives and the higher
Operating profit before depreciation and amortization .......$5,289 $ 5,216 $ 73 1.4% number of subscribers.
Operating profit before depreciation and amortization
margin ................................. 24.2% 25.7% — — Subscriber acquisition costs and SAC per subscriber, which includes the cost of
Total number of subscribers (in thousands) .............. 19,885 19,223 662 3.4%
ARPU ...................................$93.27 $ 89.71 $ 3.56 4.0% capitalized set top receivers, increased primarily due to higher subscriber demand
Average monthly subscriber churn % ................. 1.56% 1.53% — 2.0% for advanced products, as well as higher gross additions and increased dealer
Gross subscriber additions (in thousands) ............... 4,316 4,124 192 4.7%
Subscriber disconnections (in thousands) ............... 3,654 3,461 193 5.6% commissions, partially offset by lower marketing costs.
Net subscriber additions (in thousands) ................ 662 663 (1) (0.2)%
Average subscriber acquisition costs—per subscriber Upgrade and retention costs increased in 2011 due to a higher installation
(SAC)..................................$ 813 $ 796 $ 17 2.1% costs associated with higher advanced equipment upgrades.
Capital expenditures:
Property and equipment .......................$ 567 $ 477 $ 90 18.9% General and administrative expenses increased in 2011 primarily due to
Subscriber leased equipment—subscriber acquisitions ....... 713 651 62 9.5%
Subscriber leased equipment—upgrade and retention ....... 315 316 (1) (0.3)% increased labor and benefit costs related to higher incentive compensation and
Satellites ................................ 141 113 28 24.8% increased headcount, as well as higher bad debt expense associated with higher
Total capital expenditures .....................$1,736 $ 1,557 $ 179 11.5% revenue, partially offset by a decrease in property tax expenses.
Depreciation expense—subscriber leased equipment .........$ 903 $1,145 $ (242) (21.1)%
48