DIRECTV 2012 Annual Report Download - page 69
Download and view the complete annual report
Please find page 69 of the 2012 DIRECTV annual report below. You can navigate through the pages in the report by either clicking on the pages listed below, or by using the keyword search tool below to find specific information within the annual report.-
 1
1 -
2
-
3
-
4
-
5
-
6
-
7
-
8
-
9
-
10
-
11
-
12
-
13
-
14
-
15
-
16
-
17
-
18
-
19
-
20
-
21
-
22
-
23
-
24
-
25
-
26
-
27
-
28
-
29
-
30
-
31
-
32
-
33
-
34
-
35
-
36
-
37
-
38
-
39
-
40
-
41
-
42
-
43
-
44
-
45
-
46
-
47
-
48
-
49
-
50
-
51
-
52
-
53
-
54
-
55
-
56
-
57
-
58
-
 59
59 -
 60
60 -
 61
61 -
 62
62 -
 63
63 -
 64
64 -
 65
65 -
 66
66 -
 67
67 -
 68
68 -
 69
69 -
 70
70 -
 71
71 -
 72
72 -
 73
73 -
 74
74 -
 75
75 -
 76
76 -
 77
77 -
 78
78 -
 79
79 -
80
-
81
-
82
-
83
-
84
-
85
-
86
-
87
-
88
-
89
-
90
-
91
-
92
-
93
-
94
-
95
-
96
-
97
-
98
-
99
-
100
-
101
-
102
-
103
-
104
-
105
-
106
-
107
-
108
-
109
-
110
-
111
-
112
-
113
-
114
-
115
-
116
-
117
-
118
-
119
-
120
-
121
-
122
-
123
-
124
-
125
-
126
-
127
-
128
-
129
-
130
-
131
-
132
-
133
-
134
-
135
-
136
-
137
-
138
-
139
-
140
-
141
-
142
-
143
-
144
-
145
-
146
-
147
-
148
-
149
-
150
-
151
-
152
-
153
-
154
 |
 |

DIRECTV
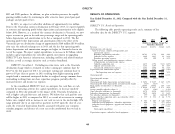
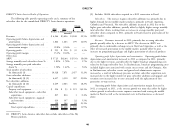
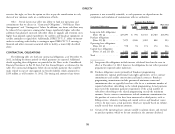
Operating profit. Operating profit and operating profit margin increased in DIRECTV Latin America Results of Operations
2011 as compared to 2010 due to lower depreciation and amortization expense in The following table provides operating results and a summary of key
2011 resulting from the change in HD set-top receiver estimated depreciable life subscriber data for the consolidated DIRECTV Latin America operations:
from three to four years, lower depreciation expense associated with a reduction in
capitalized set-top receivers over the last several years and the completion of the Change
amortization of a subscriber-related intangible asset, partially offset by lower 2011 2010 $ %
operating profit before depreciation and amortization margin. (Dollars in Millions, Except Per
Subscriber Amounts)
Revenues ......................... $5,096 $3,597 $1,499 41.7%
Operating profit before depreciation and
amortization ..................... 1,663 1,164 499 42.9%
Operating profit before depreciation and
amortization margin ................ 32.6% 32.4% — —
Operating profit .................... $ 916 $ 623 $ 293 47.0%
Operating profit margin ............... 18.0% 17.3% — —
Other data:
ARPU ........................... $62.64 $57.95 $ 4.69 8.1%
Average monthly total subscriber churn % . . . 1.78% 1.77% — 0.6%
Average monthly post paid subscriber churn % 1.42% 1.47% — (3.4)%
Total number of subscribers (in thousands) (1) 7,871 5,808 2,063 35.5%
Gross subscriber additions (in thousands) .... 3,510 2,318 1,192 51.4%
Net subscriber additions (in thousands) ..... 2,063 1,220 843 69.1%
Capital expenditures:
Property and equipment ............. $ 93 $ 60 $ 33 55.0%
Subscriber leased equipment—subscriber
acquisitions .................... 834 562 272 48.4%
Subscriber leased equipment—upgrade and
retention ...................... 397 235 162 68.9%
Satellites ........................ 104 — 104 —
Total capital expenditures ........... $1,428 $ 857 $ 571 66.6%
(1) DIRECTV Latin America subscriber data exclude subscribers of the Sky
Mexico platform.
Subscribers. The increase in gross subscriber additions was primarily due to
higher demand for our middle market products, primarily in Brazil, as well as
increased gross subscriber additions in Argentina. Net subscriber additions increased
49