DIRECTV 2012 Annual Report Download - page 116
Download and view the complete annual report
Please find page 116 of the 2012 DIRECTV annual report below. You can navigate through the pages in the report by either clicking on the pages listed below, or by using the keyword search tool below to find specific information within the annual report.-
 1
1 -
2
-
3
-
4
-
5
-
6
-
7
-
8
-
9
-
10
-
11
-
12
-
13
-
14
-
15
-
16
-
17
-
18
-
19
-
20
-
21
-
22
-
23
-
24
-
25
-
26
-
27
-
28
-
29
-
30
-
31
-
32
-
33
-
34
-
35
-
36
-
37
-
38
-
39
-
40
-
41
-
42
-
43
-
44
-
45
-
46
-
47
-
48
-
49
-
50
-
51
-
52
-
53
-
54
-
55
-
56
-
57
-
58
-
59
-
60
-
61
-
62
-
63
-
64
-
65
-
66
-
67
-
68
-
69
-
70
-
71
-
72
-
73
-
74
-
75
-
76
-
77
-
78
-
79
-
80
-
81
-
82
-
83
-
84
-
85
-
86
-
87
-
88
-
89
-
90
-
91
-
92
-
93
-
94
-
95
-
96
-
97
-
98
-
99
-
100
-
101
-
102
-
103
-
104
-
105
-
 106
106 -
 107
107 -
 108
108 -
 109
109 -
 110
110 -
 111
111 -
 112
112 -
 113
113 -
 114
114 -
 115
115 -
 116
116 -
 117
117 -
 118
118 -
 119
119 -
 120
120 -
 121
121 -
 122
122 -
 123
123 -
 124
124 -
 125
125 -
 126
126 -
127
-
128
-
129
-
130
-
131
-
132
-
133
-
134
-
135
-
136
-
137
-
138
-
139
-
140
-
141
-
142
-
143
-
144
-
145
-
146
-
147
-
148
-
149
-
150
-
151
-
152
-
153
-
154
 |
 |

DIRECTV
NOTES TO THE CONSOLIDATED FINANCIAL STATEMENTS—(continued)
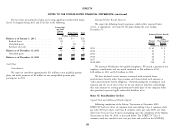
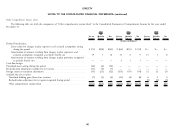
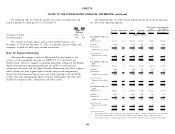
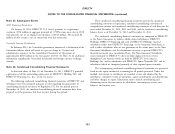
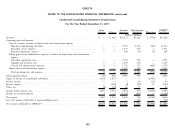
The following table sets forth the amount of accounts receivable from and The following table sets forth selected information for the results of operations
accounts payable to related parties as of December 31: for each of our reporting segments:
Depreciation Operating Profit
2012 2011 and (Loss) Before
(Dollars in External Intersegment Total Operating Amortization Depreciation and
Millions) Revenues Revenues Revenues Profit (Loss) Expense Amortization (1)
(Dollars in Millions)
Accounts receivable ................................. $26 $ 1
Year Ended December 31,
Accounts payable ................................... 90 96 2012:
DIRECTV U.S. ....... $23,227 $ 8 $23,235 $4,153 $1,501 $5,654
The accounts receivable balance and accounts payable balances as of
Sky Brasil ........... 3,501 — 3,501 555 533 1,088
December 31, 2012 and December 31, 2011 are primarily related to Globo and
PanAmericana ........ 2,743 — 2,743 400 374 774
companies in which we hold equity method investments.
DIRECTV Latin America . 6,244 — 6,244 955 907 1,862
Note 20: Segment Reporting Sports Networks,
Eliminations and Other . . 269 (8) 261 (23) 29 6
Our reportable segments, which are differentiated by their products and Total ............. $29,740 $— $29,740 $5,085 $2,437 $7,522
services as well as geographic location, are DIRECTV U.S., Sky Brasil and Year Ended December 31,
PanAmericana, which are engaged in acquiring, promoting, selling and distributing 2011:
digital entertainment programming primarily via satellite to residential and DIRECTV U.S. ....... $21,864 $ 8 $21,872 $3,702 $1,587 $5,289
commercial subscribers, and the Sports Networks, Eliminations and Other segment, Sky Brasil ........... 3,020 — 3,020 542 449 991
which includes our three regional sports networks that provide programming PanAmericana ........ 2,076 — 2,076 374 298 672
devoted to local professional sports teams and college sporting events and locally DIRECTV Latin America . 5,096 — 5,096 916 747 1,663
produce their own programming. Sports Networks, Eliminations and Other also Sports Networks,
includes the corporate office, eliminations and other entities. Eliminations and Other . . 266 (8) 258 11 15 26
Total ............. $27,226 $— $27,226 $4,629 $2,349 $6,978
Year Ended December 31,
2010:
DIRECTV U.S. ....... $20,261 $ 7 $20,268 $3,290 $1,926 $5,216
Sky Brasil ........... 2,013 — 2,013 383 298 681
PanAmericana ........ 1,584 — 1,584 240 243 483
DIRECTV Latin America . 3,597 — 3,597 623 541 1,164
Sports Networks,
Eliminations and Other . . 244 (7) 237 (17) 15 (2)
Total ............. $24,102 $— $24,102 $3,896 $2,482 $6,378
(1) Operating profit (loss) before depreciation and amortization, which is a financial measure that is not determined
in accordance with GAAP can be calculated by adding amounts under the caption ‘‘Depreciation and
amortization expense’’ to ‘‘Operating profit (loss).’’ This measure should be used in conjunction with GAAP
96