DIRECTV 2012 Annual Report Download - page 58
Download and view the complete annual report
Please find page 58 of the 2012 DIRECTV annual report below. You can navigate through the pages in the report by either clicking on the pages listed below, or by using the keyword search tool below to find specific information within the annual report.-
 1
1 -
2
-
3
-
4
-
5
-
6
-
7
-
8
-
9
-
10
-
11
-
12
-
13
-
14
-
15
-
16
-
17
-
18
-
19
-
20
-
21
-
22
-
23
-
24
-
25
-
26
-
27
-
28
-
29
-
30
-
31
-
32
-
33
-
34
-
35
-
36
-
37
-
38
-
39
-
40
-
41
-
42
-
43
-
44
-
45
-
46
-
47
-
 48
48 -
 49
49 -
 50
50 -
 51
51 -
 52
52 -
 53
53 -
 54
54 -
 55
55 -
 56
56 -
 57
57 -
 58
58 -
 59
59 -
 60
60 -
 61
61 -
 62
62 -
 63
63 -
 64
64 -
 65
65 -
 66
66 -
 67
67 -
 68
68 -
69
-
70
-
71
-
72
-
73
-
74
-
75
-
76
-
77
-
78
-
79
-
80
-
81
-
82
-
83
-
84
-
85
-
86
-
87
-
88
-
89
-
90
-
91
-
92
-
93
-
94
-
95
-
96
-
97
-
98
-
99
-
100
-
101
-
102
-
103
-
104
-
105
-
106
-
107
-
108
-
109
-
110
-
111
-
112
-
113
-
114
-
115
-
116
-
117
-
118
-
119
-
120
-
121
-
122
-
123
-
124
-
125
-
126
-
127
-
128
-
129
-
130
-
131
-
132
-
133
-
134
-
135
-
136
-
137
-
138
-
139
-
140
-
141
-
142
-
143
-
144
-
145
-
146
-
147
-
148
-
149
-
150
-
151
-
152
-
153
-
154
 |
 |

DIRECTV
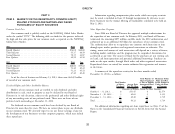
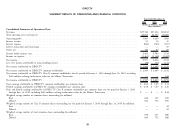
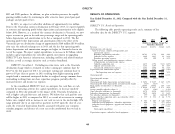
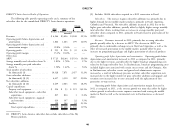
SUMMARY RESULTS OF OPERATIONS AND FINANCIAL CONDITION—(continued)
Selected Segment Data
Operating Operating
Profit (Loss) Profit Before
Depreciation Before Depreciation
Percent of and Depreciation Operating and
Total Operating Amortization and profit Amortization
Revenues Revenues Profit (Loss) Expense Amortization margin Margin
(Dollars in Millions)
December 31, 2012
DIRECTV U.S. ......................................................$23,235 78.1% $4,153 $1,501 $5,654 17.9% 24.3%
Sky Brasil ........................................................... 3,501 11.8% 555 533 1,088 15.9% 31.1%
PanAmericana ........................................................ 2,743 9.2% 400 374 774 14.6% 28.2%
DIRECTV Latin America ............................................... 6,244 21.0% 955 907 1,862 15.3% 29.8%
Sports Networks, Eliminations and Other ...................................... 261 0.9% (23) 29 6 NM* NM*
Total ..............................................................$29,740 100.0% $5,085 $2,437 $7,522 17.1% 25.3%
December 31, 2011
DIRECTV U.S. ......................................................$21,872 80.3% $3,702 $1,587 $5,289 16.9% 24.2%
Sky Brasil ........................................................... 3,020 11.1% 542 449 991 17.9% 32.8%
PanAmericana ........................................................ 2,076 7.6% 374 298 672 18.0% 32.4%
DIRECTV Latin America ............................................... 5,096 18.7% 916 747 1,663 18.0% 32.6%
Sports Networks, Eliminations and Other ...................................... 258 0.9% 11 15 26 NM* NM*
Total ..............................................................$27,226 100.0% $4,629 $2,349 $6,978 17.0% 25.6%
December 31, 2010
DIRECTV U.S. ......................................................$20,268 84.1% $3,290 $1,926 $5,216 16.2% 25.7%
Sky Brasil ........................................................... 2,013 8.4% 383 298 681 19.0% 33.8%
PanAmericana ........................................................ 1,584 6.6% 240 243 483 15.2% 30.5%
DIRECTV Latin America ............................................... 3,597 14.9% 623 541 1,164 17.3% 32.4%
Sports Networks, Eliminations and Other ...................................... 237 1.0% (17) 15 (2) NM* NM*
Total ..............................................................$24,102 100.0% $3,896 $2,482 $6,378 16.2% 26.5%
* Percentage not meaningful.
38