DIRECTV 2012 Annual Report Download - page 53
Download and view the complete annual report
Please find page 53 of the 2012 DIRECTV annual report below. You can navigate through the pages in the report by either clicking on the pages listed below, or by using the keyword search tool below to find specific information within the annual report.-
 1
1 -
2
-
3
-
4
-
5
-
6
-
7
-
8
-
9
-
10
-
11
-
12
-
13
-
14
-
15
-
16
-
17
-
18
-
19
-
20
-
21
-
22
-
23
-
24
-
25
-
26
-
27
-
28
-
29
-
30
-
31
-
32
-
33
-
34
-
35
-
36
-
37
-
38
-
39
-
40
-
41
-
42
-
 43
43 -
 44
44 -
 45
45 -
 46
46 -
 47
47 -
 48
48 -
 49
49 -
 50
50 -
 51
51 -
 52
52 -
 53
53 -
 54
54 -
 55
55 -
 56
56 -
 57
57 -
 58
58 -
 59
59 -
 60
60 -
 61
61 -
 62
62 -
 63
63 -
64
-
65
-
66
-
67
-
68
-
69
-
70
-
71
-
72
-
73
-
74
-
75
-
76
-
77
-
78
-
79
-
80
-
81
-
82
-
83
-
84
-
85
-
86
-
87
-
88
-
89
-
90
-
91
-
92
-
93
-
94
-
95
-
96
-
97
-
98
-
99
-
100
-
101
-
102
-
103
-
104
-
105
-
106
-
107
-
108
-
109
-
110
-
111
-
112
-
113
-
114
-
115
-
116
-
117
-
118
-
119
-
120
-
121
-
122
-
123
-
124
-
125
-
126
-
127
-
128
-
129
-
130
-
131
-
132
-
133
-
134
-
135
-
136
-
137
-
138
-
139
-
140
-
141
-
142
-
143
-
144
-
145
-
146
-
147
-
148
-
149
-
150
-
151
-
152
-
153
-
154
 |
 |

DIRECTV
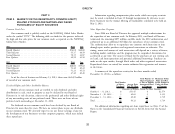
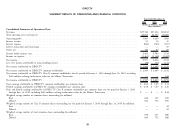
ITEM 6. SELECTED FINANCIAL DATA
Years Ended December 31,
2012 2011 2010 2009 2008
(Dollars in Millions, Except Per Share Amounts)
Consolidated Statements of Operations Data:
Revenues ............................................................................ $29,740 $27,226 $24,102 $21,565 $19,693
Total operating costs and expenses ............................................................ 24,655 22,597 20,206 18,892 16,998
Operating profit ....................................................................... $ 5,085 $ 4,629 $ 3,896 $ 2,673 $ 2,695
Net income attributable to DIRECTV ......................................................... $ 2,949 $ 2,609 $ 2,198 $ 942 $ 1,515
Basic earnings attributable to DIRECTV common stockholders per common share ............................. $ 4.62 $ 3.49 $ 2.31 $ 0.96 $ 1.36
Diluted earnings attributable to DIRECTV common stockholders per common share ........................... $ 4.58 $ 3.47 $ 2.30 $ 0.95 $ 1.36
Basic and diluted earnings (loss) attributable to DIRECTV Class B common stockholders per common share, for the period of
November 19, 2009 through June 16, 2010, including $160 million exchange inducement value for the Malone Transaction $ — $ — $ 8.44 $ (0.02) $ —
Weighted average number of common shares outstanding (in millions):
Basic ............................................................................. 638 747 870 982 1,110
Diluted ........................................................................... 644 752 876 989 1,114
Weighted average number of Class B common shares outstanding, for the period of November 19, 2009 through June 16,
2010 (in millions):
Basic ............................................................................. — — 22 22 —
Diluted ........................................................................... — — 22 22 —
Weighted average number of total common shares outstanding (in millions):
Basic ............................................................................. 638 747 880 985 1,110
Diluted ........................................................................... 644 752 886 992 1,114
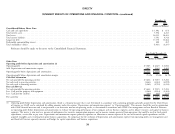
As of December 31,
2012 2011 2010 2009 2008
(Dollars in Millions)
Consolidated Balance Sheets Data:
Total assets ........................................................................... $20,555 $18,423 $17,909 $18,260 $16,539
Obligations under capital leases .............................................................. 528 545 580 586 584
Long-term debt ........................................................................ 17,170 13,464 10,472 6,500 5,725
Total stockholders’ equity (deficit) ............................................................ (5,431) (3,107) (194) 2,911 4,631
See the Notes to the Consolidated Financial Statements and Management’s Discussion and Analysis of Financial Condition and Results of Operations for additional
information regarding significant transactions during each of the three years in the period ended December 31, 2012.
33