DIRECTV 2012 Annual Report Download - page 64
Download and view the complete annual report
Please find page 64 of the 2012 DIRECTV annual report below. You can navigate through the pages in the report by either clicking on the pages listed below, or by using the keyword search tool below to find specific information within the annual report.-
 1
1 -
2
-
3
-
4
-
5
-
6
-
7
-
8
-
9
-
10
-
11
-
12
-
13
-
14
-
15
-
16
-
17
-
18
-
19
-
20
-
21
-
22
-
23
-
24
-
25
-
26
-
27
-
28
-
29
-
30
-
31
-
32
-
33
-
34
-
35
-
36
-
37
-
38
-
39
-
40
-
41
-
42
-
43
-
44
-
45
-
46
-
47
-
48
-
49
-
50
-
51
-
52
-
53
-
 54
54 -
 55
55 -
 56
56 -
 57
57 -
 58
58 -
 59
59 -
 60
60 -
 61
61 -
 62
62 -
 63
63 -
 64
64 -
 65
65 -
 66
66 -
 67
67 -
 68
68 -
 69
69 -
 70
70 -
 71
71 -
 72
72 -
 73
73 -
 74
74 -
75
-
76
-
77
-
78
-
79
-
80
-
81
-
82
-
83
-
84
-
85
-
86
-
87
-
88
-
89
-
90
-
91
-
92
-
93
-
94
-
95
-
96
-
97
-
98
-
99
-
100
-
101
-
102
-
103
-
104
-
105
-
106
-
107
-
108
-
109
-
110
-
111
-
112
-
113
-
114
-
115
-
116
-
117
-
118
-
119
-
120
-
121
-
122
-
123
-
124
-
125
-
126
-
127
-
128
-
129
-
130
-
131
-
132
-
133
-
134
-
135
-
136
-
137
-
138
-
139
-
140
-
141
-
142
-
143
-
144
-
145
-
146
-
147
-
148
-
149
-
150
-
151
-
152
-
153
-
154
 |
 |

DIRECTV
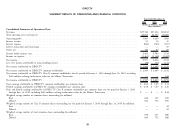
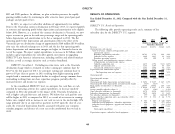
HD and DVR products. In addition, we plan to further penetrate the rapidly RESULTS OF OPERATIONS
growing middle market by continuing to offer attractive lower priced post-paid Year Ended December 31, 2012 Compared with the Year Ended December 31,
packages and pre-paid services. 2011
In 2013, we expect net subscriber additions of approximately two million. DIRECTV U.S. Results of Operations
Prior to the Venezuelan currency devaluation in February 2013, we expected growth
in revenues and operating profit before depreciation and amortization to be slightly The following table provides operating results and a summary of key
below 20%. However, as a result of the currency devaluation in Venezuela, we now subscriber data for the DIRECTV U.S. segment:
expect revenues to grow in the mid-teen percentage range and for operating profit Change
before depreciation and amortization to be flat as compared to 2012. The flat 2012 2011 $ %
operating profit before depreciation and amortization reflects the effect of the (Dollars in Millions, Except Per
Venezuelan pre-tax devaluation charge of approximately $160 million ($150 million Subscriber Amounts)
after tax), the reduced exchange rate in 2013 and the fact that operating profit Revenues .................................$23,235 $21,872 $1,363 6.2%
Operating costs and expenses
before depreciation and amortization margins are higher in Venezuela than in the Costs of revenues, exclusive of depreciation and
rest of the region. We expect capital expenditures to increase to $2 billion, which amortization expense
Broadcast programming and other ................ 10,743 9,799 944 9.6%
includes capital expenditures for subscriber growth, investments in upgrading Subscriber service expenses .................... 1,464 1,435 29 2.0%
DIRECTV Latin America’s infrastructure, including satellites and related broadcast Broadcast operations expenses ................... 306 300 6 2.0%
Selling, general and administrative expenses, exclusive
facilities, as well as strategic initiatives such as wireless broadband. of depreciation and amortization expense
Subscriber acquisition costs .................... 2,673 2,794 (121) (4.3)%
DIRECTV Consolidated. Excluding one-time items such as the Venezuela Upgrade and retention costs ................... 1,253 1,209 44 3.6%
General and administrative expenses ............... 1,142 1,046 96 9.2%
devaluation charge which is estimated to reduce earning per common share by Depreciation and amortization expense ................ 1,501 1,587 (86) (5.4)%
$0.27 in the first quarter of 2013, we anticipate earnings per common share to Total operating costs and expenses .............. 19,082 18,170 912 5.0%
grow to $5 per share or greater in 2013 resulting from higher operating profit Operating profit .............................$4,153 $ 3,702 $ 451 12.2%
coupled with a continued anticipated decline in weighted average common shares Operating profit margin ......................... 17.9% 16.9% — —
outstanding resulting from our share repurchase program, partially offset by Other data:
Operating profit before depreciation and amortization .......$5,654 $ 5,289 $ 365 6.9%
increased interest and income tax expenses. Operating profit before depreciation and amortization margin . . . 24.3% 24.2% — —
Total number of subscribers (in thousands) .............. 20,084 19,885 199 1.0%
At the consolidated DIRECTV level, we anticipate free cash flow, or cash ARPU ...................................$96.98 $ 93.27 $ 3.71 4.0%
provided by operating activities less capital expenditures, to decrease modestly Average monthly subscriber churn % ................. 1.53% 1.56% — (1.9)%
Gross subscriber additions (in thousands) ............... 3,874 4,316 (442) (10.2)%
compared to 2012 due primarily to the impact of the Venezuela devaluation, as Subscriber disconnections (in thousands) ............... 3,675 3,654 21 0.6%
well as higher cash paid for taxes and interest. We believe that cash paid for taxes Net subscriber additions (in thousands) ................ 199 662 (463) (69.9)%
Average subscriber acquisition costs—per subscriber (SAC) .....$ 859 $ 813 $ 46 5.7%
will be higher in 2013 as compared to 2012, as a result of an increase in earnings Capital expenditures:
before taxes coupled with an increase in our cash tax rate to the mid-to-high 30% Property and equipment .......................$ 541 $ 567 $ (26) (4.6)%
Subscriber leased equipment—subscriber acquisitions ....... 656 713 (57) (8.0)%
range primarily due to an expected tax payment in 2013 upon the close of a tax Subscriber leased equipment—upgrade and retention ....... 291 315 (24) (7.6)%
audit, the reversal of depreciation benefits associated with prior year economic Satellites ................................ 253 141 112 79.4%
stimulus programs and absence of a state tax credit carryforward that we had in Total capital expenditures .....................$1,741 $ 1,736 $ 5 0.3%
2012. Depreciation expense—subscriber leased equipment .........$ 815 $ 903 $ (88) (9.7)%
44