DIRECTV 2012 Annual Report Download - page 106
Download and view the complete annual report
Please find page 106 of the 2012 DIRECTV annual report below. You can navigate through the pages in the report by either clicking on the pages listed below, or by using the keyword search tool below to find specific information within the annual report.-
 1
1 -
2
-
3
-
4
-
5
-
6
-
7
-
8
-
9
-
10
-
11
-
12
-
13
-
14
-
15
-
16
-
17
-
18
-
19
-
20
-
21
-
22
-
23
-
24
-
25
-
26
-
27
-
28
-
29
-
30
-
31
-
32
-
33
-
34
-
35
-
36
-
37
-
38
-
39
-
40
-
41
-
42
-
43
-
44
-
45
-
46
-
47
-
48
-
49
-
50
-
51
-
52
-
53
-
54
-
55
-
56
-
57
-
58
-
59
-
60
-
61
-
62
-
63
-
64
-
65
-
66
-
67
-
68
-
69
-
70
-
71
-
72
-
73
-
74
-
75
-
76
-
77
-
78
-
79
-
80
-
81
-
82
-
83
-
84
-
85
-
86
-
87
-
88
-
89
-
90
-
91
-
92
-
93
-
94
-
95
-
 96
96 -
 97
97 -
 98
98 -
 99
99 -
 100
100 -
 101
101 -
 102
102 -
 103
103 -
 104
104 -
 105
105 -
 106
106 -
 107
107 -
 108
108 -
 109
109 -
 110
110 -
 111
111 -
 112
112 -
 113
113 -
 114
114 -
 115
115 -
 116
116 -
117
-
118
-
119
-
120
-
121
-
122
-
123
-
124
-
125
-
126
-
127
-
128
-
129
-
130
-
131
-
132
-
133
-
134
-
135
-
136
-
137
-
138
-
139
-
140
-
141
-
142
-
143
-
144
-
145
-
146
-
147
-
148
-
149
-
150
-
151
-
152
-
153
-
154
 |
 |

DIRECTV
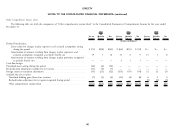
NOTES TO THE CONSOLIDATED FINANCIAL STATEMENTS—(continued)
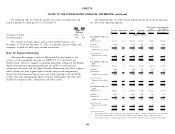
Components of net periodic benefit cost for the years ended December 31: Weighted-average assumptions used to determine net periodic benefit cost for
the years ended December 31:
Other
Pension Postretirement Other
Benefits Benefits Pension Postretirement
2012 2011 2010 2012 2011 2010 Benefits Benefits
(Dollars in Millions) 2012 2011 2010 2012 2011 2010
Components of net periodic benefit Discount rate—Qualified Plan ...... 4.99% 5.59% 5.64% 4.48% 4.99% 5.21%
cost Discount rate—Non-Qualified Plans . . 4.92% 5.54% 5.63% — — —
Benefits earned during the year ...... $32 $25 $19 $ 1 $ 1 $1 Expected long-term return on plan
Interest accrued on benefits earned in assets ..................... 7.75% 8.00% 8.25% — — —
prior years .................. 30 29 28 1 1 1 Rate of compensation increase ...... 4.00% 4.00% 4.00% 4.00% 4.00% 4.00%
Expected return on plan assets ...... (34) (34) (32) — — —
We base our expected long-term return on plan assets assumption on a
Amortization components
periodic review and modeling of the plans’ asset allocation and liability structure
Amount resulting from changes in
over a long-term horizon. Expectations of returns for each asset class are the most
plan provisions .............111——(1)
important of the assumptions used in the review and modeling and are based on
Net amount resulting from changes
the forward looking expectations for asset class returns, historical data and
in plan experience and actuarial
economic/financial market theory.
assumptions ............... 19 14 14 — — —
Net periodic benefit cost .......... $48 $35 $30 $ 2 $ 2 $1 The following table provides assumed health care costs trend rates:
2012 2011 2010
Assumptions Health care cost trend rate ...................... 8.00% 8.00% 8.00%
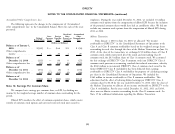
Weighted-average assumptions used to determine benefit obligations at Rate to which the cost trend rate is assumed to decline
December 31: (ultimate trend rate) ......................... 5.00% 5.00% 5.00%
Year that trend rate reaches the ultimate trend rate ...... 2017 2017 2017
Other
Pension Postretirement
Benefits Benefits Plan Assets
2012 2011 2012 2011 Our investment policy includes various guidelines and procedures designed to
Discount rate—Qualified Plans ............. 3.92% 4.99% 3.47% 4.48% ensure we invest assets in a manner necessary to meet expected future benefits
Discount rate—Non-Qualified Plans .......... 3.91% 4.92% — — earned by participants. The investment guidelines consider a broad range of
Rate of compensation increase .............. 4.00% 4.00% 4.00% 4.00% economic conditions. Central to the policy are target allocation ranges by major
asset categories. The policy range for plan assets are 20% to 60% equity securities,
30% to 50% debt securities, 0% to 40% alternatives and other types of
investments.
86