DIRECTV 2012 Annual Report Download - page 130
Download and view the complete annual report
Please find page 130 of the 2012 DIRECTV annual report below. You can navigate through the pages in the report by either clicking on the pages listed below, or by using the keyword search tool below to find specific information within the annual report.-
 1
1 -
2
-
3
-
4
-
5
-
6
-
7
-
8
-
9
-
10
-
11
-
12
-
13
-
14
-
15
-
16
-
17
-
18
-
19
-
20
-
21
-
22
-
23
-
24
-
25
-
26
-
27
-
28
-
29
-
30
-
31
-
32
-
33
-
34
-
35
-
36
-
37
-
38
-
39
-
40
-
41
-
42
-
43
-
44
-
45
-
46
-
47
-
48
-
49
-
50
-
51
-
52
-
53
-
54
-
55
-
56
-
57
-
58
-
59
-
60
-
61
-
62
-
63
-
64
-
65
-
66
-
67
-
68
-
69
-
70
-
71
-
72
-
73
-
74
-
75
-
76
-
77
-
78
-
79
-
80
-
81
-
82
-
83
-
84
-
85
-
86
-
87
-
88
-
89
-
90
-
91
-
92
-
93
-
94
-
95
-
96
-
97
-
98
-
99
-
100
-
101
-
102
-
103
-
104
-
105
-
106
-
107
-
108
-
109
-
110
-
111
-
112
-
113
-
114
-
115
-
116
-
117
-
118
-
119
-
 120
120 -
 121
121 -
 122
122 -
 123
123 -
 124
124 -
 125
125 -
 126
126 -
 127
127 -
 128
128 -
 129
129 -
 130
130 -
 131
131 -
 132
132 -
 133
133 -
 134
134 -
 135
135 -
 136
136 -
 137
137 -
 138
138 -
 139
139 -
 140
140 -
141
-
142
-
143
-
144
-
145
-
146
-
147
-
148
-
149
-
150
-
151
-
152
-
153
-
154
 |
 |

DIRECTV
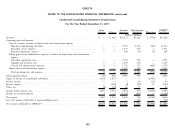
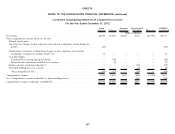
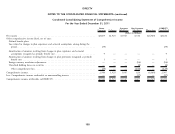
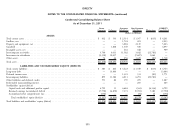
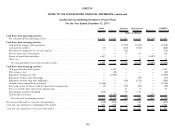
NOTES TO THE CONSOLIDATED FINANCIAL STATEMENTS—(continued)
Condensed Consolidating Balance Sheet
As of December 31, 2012
Parent Guarantor Non-Guarantor DIRECTV
Guarantor Co-Issuers Subsidiaries Subsidiaries Eliminations Consolidated
(Dollars in Millions)
ASSETS
Total current assets .................................................. $ 883 $ 884 $ 2,788 $ 2,039 $ (1,040) $ 5,554
Satellites, net ...................................................... — — 1,795 562 — 2,357
Property and equipment, net ............................................ — — 3,290 2,748 — 6,038
Goodwill ......................................................... — 1,828 1,349 886 — 4,063
Intangible assets, net ................................................. — — 453 379 — 832
Intercompany receivables .............................................. 4,382 6,152 16,355 3,703 (30,592) —
Investment in subsidiaries .............................................. (8,687) 15,001 — (10,915) 4,601 —
Other assets ....................................................... 180 91 241 1,294 (95) 1,711
Total assets ....................................................... $(3,242) $ 23,956 $26,271 $ 696 $(27,126) $20,555
LIABILITIES AND STOCKHOLDERS’ EQUITY (DEFICIT)
Total current liabilities ................................................ $ 384 $ 646 $ 3,526 $ 2,025 $ (1,040) $ 5,541
Long-term debt .................................................... — 17,170 — — — 17,170
Deferred income taxes ................................................ — — 1,397 361 (86) 1,672
Intercompany liabilities ............................................... 1,401 16,355 6,152 6,684 (30,592) —
Other liabilities and deferred credits ....................................... 404 131 195 482 (9) 1,203
Redeemable noncontrolling interest ....................................... — — — 400 — 400
Stockholders’ equity (deficit)
Capital stock and additional paid-in capital ................................ 4,021 12 4,802 (6,632) 1,818 4,021
Retained earnings (accumulated deficit) ................................... (9,210) (10,341) 10,199 (2,560) 2,702 (9,210)
Accumulated other comprehensive loss .................................... (242) (17) — (64) 81 (242)
Total stockholders’ equity (deficit) ..................................... (5,431) (10,346) 15,001 (9,256) 4,601 (5,431)
Total liabilities and stockholders’ equity (deficit) ............................... $(3,242) $ 23,956 $26,271 $ 696 $(27,126) $20,555
110