Costco 2011 Annual Report Download - page 72
Download and view the complete annual report
Please find page 72 of the 2011 Costco annual report below. You can navigate through the pages in the report by either clicking on the pages listed below, or by using the keyword search tool below to find specific information within the annual report.-
 1
1 -
2
-
3
-
4
-
5
-
6
-
7
-
8
-
9
-
10
-
11
-
12
-
13
-
14
-
15
-
16
-
17
-
18
-
19
-
20
-
21
-
22
-
23
-
24
-
25
-
26
-
27
-
28
-
29
-
30
-
31
-
32
-
33
-
34
-
35
-
36
-
37
-
38
-
39
-
40
-
41
-
42
-
43
-
44
-
45
-
46
-
47
-
48
-
49
-
50
-
51
-
52
-
53
-
54
-
55
-
56
-
57
-
58
-
59
-
60
-
61
-
 62
62 -
 63
63 -
 64
64 -
 65
65 -
 66
66 -
 67
67 -
 68
68 -
 69
69 -
 70
70 -
 71
71 -
 72
72 -
 73
73 -
 74
74 -
 75
75 -
 76
76 -
 77
77 -
 78
78 -
 79
79 -
 80
80 -
 81
81 -
 82
82 -
83
-
84
-
85
-
86
-
87
 |
 |

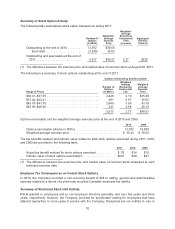
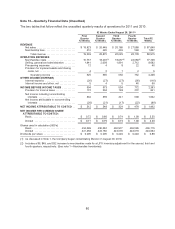
Summary of Stock Option Activity
The following table summarizes stock option transactions during 2011:
Number Of
Options
(in 000’s)
Weighted-
Average
Exercise
Price
Weighted-
Average
Remaining
Contractual
Term
(in years)
Aggregate
Intrinsic
Value(1)
Outstanding at the end of 2010 ......... 13,162 $39.50
Exercised ....................... (7,245) 39.03
Outstanding and exercisable at the end of
2011 ............................. 5,917 $40.07 2.77 $220
(1) The difference between the exercise price and market value of common stock at August 28, 2011.
The following is a summary of stock options outstanding at the end of 2011:
Options Outstanding and Exercisable
Range of Prices
Number of
Options
(in 000’s)
Weighted
Average
Remaining
Contractual
Life
Weighted
Average
Exercise
Price
$30.41–$37.35 ................................. 2,446 2.19 $35.38
$37.44–$42.41 ................................. 481 0.67 39.05
$43.79–$43.79 ................................. 2,649 3.59 43.79
$45.99–$46.46 ................................. 341 3.58 46.19
5,917 2.77 $40.07
Options exercisable and the weighted average exercise price at the end of 2010 and 2009:
2010 2009
Options exercisable (shares in 000’s) ............................ 13,032 16,588
Weighted average exercise price ............................... $ 39.43 $ 39.62
The tax benefits realized and intrinsic value related to total stock options exercised during 2011, 2010,
and 2009 are provided in the following table:
2011 2010 2009
Actual tax benefit realized for stock options exercised ......... $ 78 $34 $10
Intrinsic value of stock options exercised(1) ................. $227 $98 $27
(1) The difference between the exercise price and market value of common stock measured at each
individual exercise date.
Employee Tax Consequences on Certain Stock Options
In 2010, the Company recorded a non-recurring benefit of $24 to selling, general and administrative
expense related to a refund of a previously recorded Canadian employee tax liability.
Summary of Restricted Stock Unit Activity
RSUs granted to employees and to non-employee directors generally vest over five years and three
years, respectively; however, the Company provides for accelerated vesting for employees that have
attained twenty-five or more years of service with the Company. Recipients are not entitled to vote or
70