Costco 2011 Annual Report Download - page 3
Download and view the complete annual report
Please find page 3 of the 2011 Costco annual report below. You can navigate through the pages in the report by either clicking on the pages listed below, or by using the keyword search tool below to find specific information within the annual report.-
 1
1 -
 2
2 -
 3
3 -
 4
4 -
 5
5 -
 6
6 -
 7
7 -
 8
8 -
 9
9 -
 10
10 -
 11
11 -
 12
12 -
 13
13 -
 14
14 -
15
-
16
-
17
-
18
-
19
-
20
-
21
-
22
-
23
-
24
-
25
-
26
-
27
-
28
-
29
-
30
-
31
-
32
-
33
-
34
-
35
-
36
-
37
-
38
-
39
-
40
-
41
-
42
-
43
-
44
-
45
-
46
-
47
-
48
-
49
-
50
-
51
-
52
-
53
-
54
-
55
-
56
-
57
-
58
-
59
-
60
-
61
-
62
-
63
-
64
-
65
-
66
-
67
-
68
-
69
-
70
-
71
-
72
-
73
-
74
-
75
-
76
-
77
-
78
-
79
-
80
-
81
-
82
-
83
-
84
-
85
-
86
-
87
 |
 |
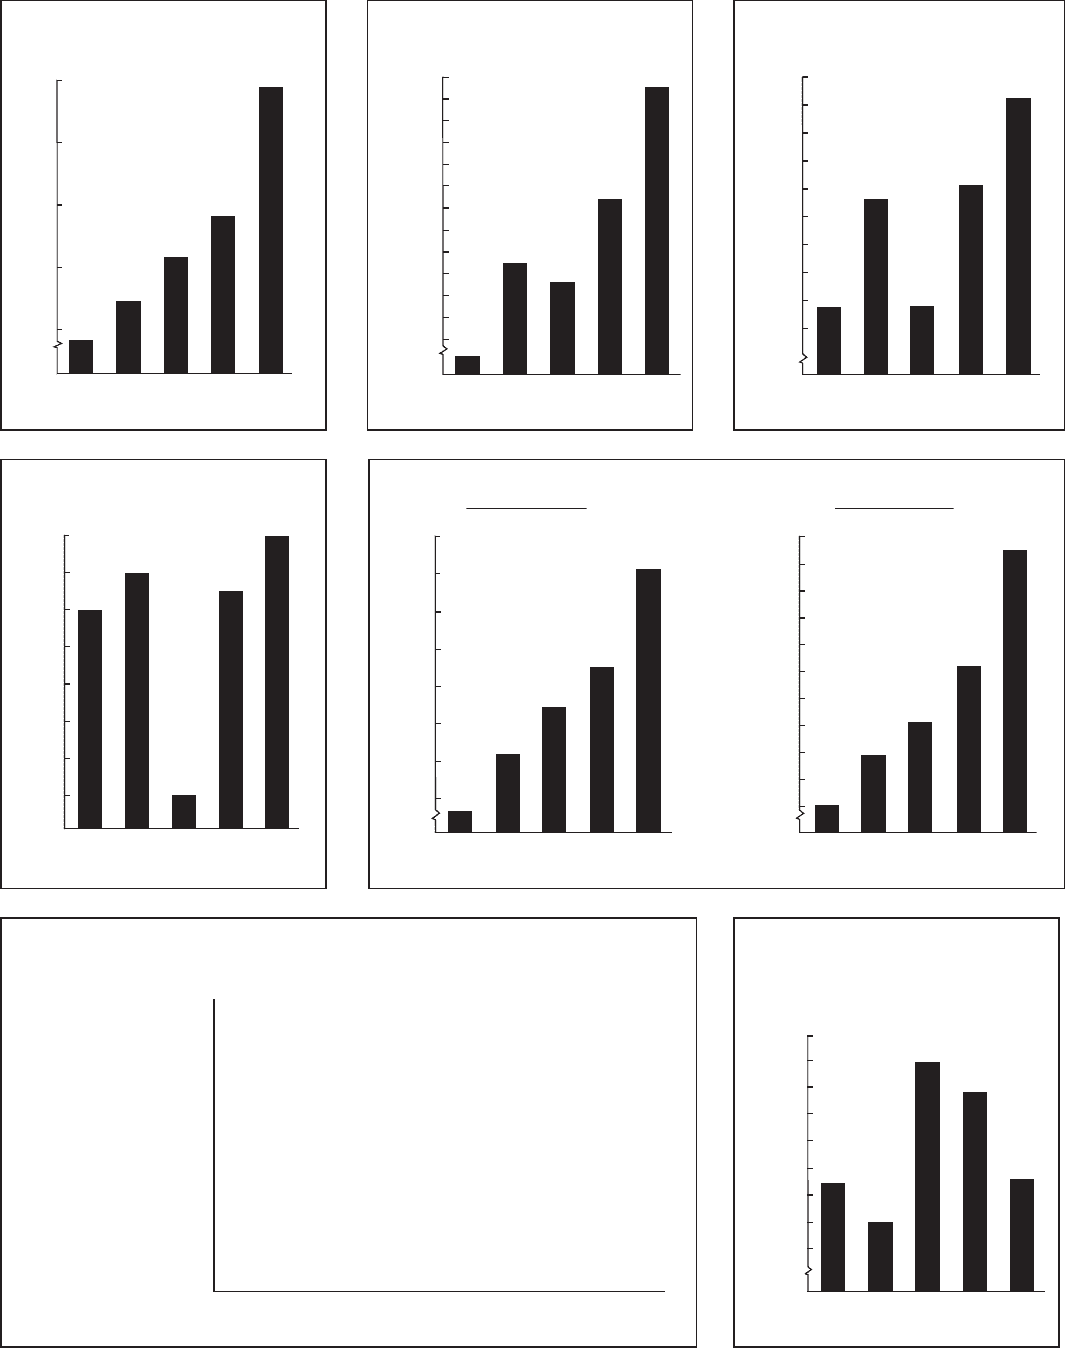
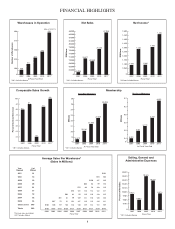
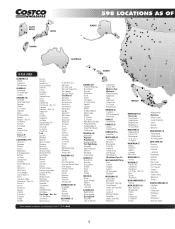
Warehouses in Operation
At Fiscal Year End
(598 at 12/31/11)
0
500
525
550
488
512
527
540
592
575
600
Number of Warehouses
*2011 Includes Mexico
2007 2010 2011*20092008
Comparable Sales Growth
Fiscal Year
-4%
-2%
0%
2%
4%
6%
8%
10%
6%
8%
10%
-4%
7%
Percent Increase/Decrease
*2011 Includes Mexico
2007 2010 2011*2009
2008
Selling, General and
Administrative Expenses
Fiscal Year
2007 2008
0
10.10%
10.20%
10.30%
10.40%
10.50%
9.90%
9.80%
10.00%
2009 2010 2011*
9.70%
9.80%
9.94%
10.38%
10.28%
9.97%
Percent of Net Sales
*2011 Includes Mexico
Gold Star Members Business Members
Membership
At Fiscal Year End
0
18.619
20.181
22.539
25.028
23
20
22
21
21.445
24
19
26
25
Millions
*2011 Includes Mexico
2007 2010 2011*2009
2008
At Fiscal Year End
5.4
5.6
5.8
6.0
6.2
6.4
0
5.401
5.594
5.719
5.789
6.352
Millions
2007 2010 2011*2009
2008
Ye a r
Opened
# of
Whses
2011 $103
2010 13 $94 106
2009 20 $100 107 130
2008 26 $86 83 99 116
2007 31 $76 88 92 103 116
2006 27 $92 101 118 114 122 127
2005 18 $63 81 95 110 116 128 129
2004 22 $72 81 99 109 121 118 126 130
2003 $67 79 91 101 107 116 119 126 131
2002 & Before 390
592
$103 108 119 126 134 140 149 142 151 159
Totals $103 $105 $115 $120 $127 $130 $137 $131 $139 $146
Fiscal Year
Average Sales Per Warehouse*
(Sales In Millions)
*First year sales annualized.
2011 Includes Mexico
21
24
2002 2003 2004 2005 2006 2007 2008 2009 2010 2011
Net Sales
Fiscal Year
66,000
70,000
68,000
72,000
74,000
76,000
78,000
80,000
82,000
84,000
63,088
70,977
69,889
0
86,000
88,000
76,255
87,048
64,000
$ Millions
2007 2010 2011*20092008
*2011 Includes Mexico
Net Income*
Fiscal Year
0
1,450
1,500
1,300
1,350
1,400
1,050
1,250
1,100
1,150
1,200
1,083
1,283
1,086
1,303
1,462
$ Millions
2007 2010 20112009
2008
*All Years Include Mexico
FINANCIAL HIGHLIGHTS
1