Costco 2011 Annual Report Download - page 51
Download and view the complete annual report
Please find page 51 of the 2011 Costco annual report below. You can navigate through the pages in the report by either clicking on the pages listed below, or by using the keyword search tool below to find specific information within the annual report.-
 1
1 -
2
-
3
-
4
-
5
-
6
-
7
-
8
-
9
-
10
-
11
-
12
-
13
-
14
-
15
-
16
-
17
-
18
-
19
-
20
-
21
-
22
-
23
-
24
-
25
-
26
-
27
-
28
-
29
-
30
-
31
-
32
-
33
-
34
-
35
-
36
-
37
-
38
-
39
-
40
-
 41
41 -
 42
42 -
 43
43 -
 44
44 -
 45
45 -
 46
46 -
 47
47 -
 48
48 -
 49
49 -
 50
50 -
 51
51 -
 52
52 -
 53
53 -
 54
54 -
 55
55 -
 56
56 -
 57
57 -
 58
58 -
 59
59 -
 60
60 -
 61
61 -
62
-
63
-
64
-
65
-
66
-
67
-
68
-
69
-
70
-
71
-
72
-
73
-
74
-
75
-
76
-
77
-
78
-
79
-
80
-
81
-
82
-
83
-
84
-
85
-
86
-
87
 |
 |

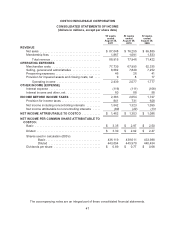
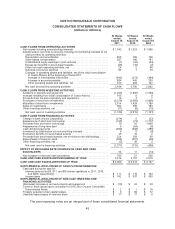
COSTCO WHOLESALE CORPORATION
CONSOLIDATED STATEMENTS OF CASH FLOWS
(dollars in millions)
52 Weeks
ended
August 28,
2011
52 Weeks
ended
August 29,
2010
52 Weeks
ended
August 30,
2009
CASH FLOWS FROM OPERATING ACTIVITIES
Net income including noncontrolling interests .......................... $1,542 $ 1,323 $ 1,099
Adjustments to reconcile net income including noncontrolling interests to net
cash provided by operating activities:
Depreciation and amortization ..................................... 855 795 728
Stock-based compensation ....................................... 207 190 181
Undistributed equity earnings in joint ventures ........................ (1) (42) (33)
Excess tax benefits on stock-based awards .......................... (45) (10) (2)
Other non-cash operating activities, net ............................. 24 2 46
Deferred income tax expense ..................................... 84 7 70
Changes in operating assets and liabilities, net of the initial consolidation
of Costco Mexico at the beginning of fiscal 2011:
Increase in merchandise inventories .............................. (642) (213) (394)
Increase in accounts payable .................................... 804 445 255
Other operating assets and liabilities, net .......................... 370 283 142
Net cash provided by operating activities ............................ 3,198 2,780 2,092
CASH FLOWS FROM INVESTING ACTIVITIES
Additions to property and equipment ................................. (1,290) (1,055) (1,250)
Increase resulting from initial consolidation of Costco Mexico ............. 165 0 0
Proceeds from the sale of property and equipment ...................... 16 4 7
Purchases of short-term investments ................................. (3,276) (2,693) (1,806)
Maturities of short-term investments .................................. 2,614 1,428 1,780
Sales of investments ............................................... 602 309 183
Other investing activities, net ........................................ (11) (8) (15)
Net cash used in investing activities ................................ (1,180) (2,015) (1,101)
CASH FLOWS FROM FINANCING ACTIVITIES
Change in bank checks outstanding .................................. (514) 5 (22)
Repayments of short-term borrowings ................................ (105) (73) (1,777)
Proceeds from short-term borrowings ................................. 79 81 1,669
Repayments of long-term debt ....................................... 0 (84) (6)
Cash dividend payments ........................................... (389) (338) (296)
Investment by (distribution to) noncontrolling interests ................... 9 0 (9)
Excess tax benefits on stock-based awards ............................ 45 10 2
Proceeds from stock-based awards, net of minimum tax withholdings ...... 224 193 69
Repurchases of common stock ...................................... (624) (551) (69)
Other financing activities, net ........................................ (2) 38 0
Net cash used in financing activities ................................ (1,277) (719) (439)
EFFECT OF EXCHANGE RATE CHANGES ON CASH AND CASH
EQUIVALENTS ................................................... 54 11 (14)
Net increase in cash and cash equivalents ............................ 795 57 538
CASH AND CASH EQUIVALENTS BEGINNING OF YEAR ................ 3,214 3,157 2,619
CASH AND CASH EQUIVALENTS END OF YEAR ...................... $4,009 $ 3,214 $ 3,157
SUPPLEMENTAL DISCLOSURE OF CASH FLOW INFORMATION:
Cash paid during the year for:
Interest (reduced by $9, $11, and $8 interest capitalized in 2011, 2010,
and 2009, respectively) ......................................... $ 111 $ 110 $ 104
Income taxes ................................................... $ 742 $ 637 $ 565
SUPPLEMENTAL DISCLOSURE OF NON-CASH INVESTING AND
FINANCING ACTIVITIES:
(Decrease) Increase in accrued property and equipment ................. $ (10) $ 24 $ 20
Common stock issued upon conversion of 3.5% Zero Coupon Convertible
Subordinated Notes ............................................. $ 2 $ 1 $ 19
Property acquired under capital leases ................................ $ 0 $ 90 $ 72
Unsettled repurchases of common stock .............................. $ 17 $ 17 $ 0
The accompanying notes are an integral part of these consolidated financial statements.
49