Costco 2011 Annual Report Download - page 29
Download and view the complete annual report
Please find page 29 of the 2011 Costco annual report below. You can navigate through the pages in the report by either clicking on the pages listed below, or by using the keyword search tool below to find specific information within the annual report.-
 1
1 -
2
-
3
-
4
-
5
-
6
-
7
-
8
-
9
-
10
-
11
-
12
-
13
-
14
-
15
-
16
-
17
-
18
-
 19
19 -
 20
20 -
 21
21 -
 22
22 -
 23
23 -
 24
24 -
 25
25 -
 26
26 -
 27
27 -
 28
28 -
 29
29 -
 30
30 -
 31
31 -
 32
32 -
 33
33 -
 34
34 -
 35
35 -
 36
36 -
 37
37 -
 38
38 -
 39
39 -
40
-
41
-
42
-
43
-
44
-
45
-
46
-
47
-
48
-
49
-
50
-
51
-
52
-
53
-
54
-
55
-
56
-
57
-
58
-
59
-
60
-
61
-
62
-
63
-
64
-
65
-
66
-
67
-
68
-
69
-
70
-
71
-
72
-
73
-
74
-
75
-
76
-
77
-
78
-
79
-
80
-
81
-
82
-
83
-
84
-
85
-
86
-
87
 |
 |

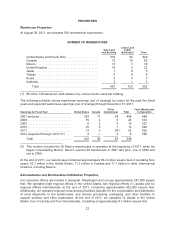
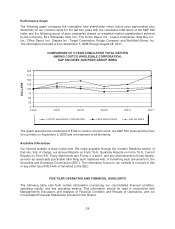
Key items for 2011 included:
• Net sales increased 14.2% to $87,048, driven by a 10% increase in comparable sales and
sales at the 20 net new warehouses opened in fiscal 2011. Net sales were favorably
impacted by increases in the price of gasoline and by foreign currencies strengthening
against the U.S. dollar;
• Membership fees increased 10.4% to $1,867, primarily due to the increased penetration of
the higher-fee Executive Membership program and new membership sign-ups;
• Gross margin (net sales less merchandise costs) as a percentage of net sales decreased 14
basis points and included a pre-tax last in, first out (LIFO) inventory charge of $87. There
was no LIFO charge in 2010;
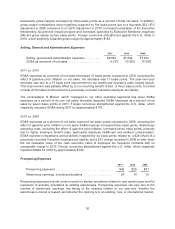
• Selling, general and administrative (SG&A) expenses as a percentage of net sales
decreased 31 basis points;
• Net income attributable to Costco increased 12.2% to $1,462, or $3.30 per diluted share
compared to $1,303, or $2.92 per diluted share in 2010. The previously mentioned LIFO
charge negatively impacted diluted earnings per share by $0.12;
• The Board of Directors approved an increase in the quarterly cash dividend from $0.205 to
$0.24 per share;
• We repurchased 8,939,000 shares of our common stock, at an average cost of $71.74 per
share, totaling approximately $641;
• The Board of Directors authorized the repurchase of an additional $4,000 of our common
stock under a repurchase program expiring in April 2015; and
• In August 2011, we announced the retirement of Jim Sinegal as our Chief Executive Officer,
effective January 1, 2012. The Board of Directors elected Craig Jelinek, currently President
and Chief Operating Officer, as President and Chief Executive Officer effective January 1,
2012. Mr. Sinegal will remain with Costco in an advisory role until February 2013. In addition,
he will continue to serve on the Board of Directors.
Certain percentages presented are calculated using actual results prior to rounding. Unless otherwise
noted, references to net income relate to net income attributable to Costco.
Only the 2011 data in the accompanying tables includes Mexico.
Results of Operations
Net Sales
2011 2010 2009
Net sales .................................... $87,048 $76,255 $69,889
Net sales increase (decrease) .................. 14.2% 9.1% (1.5%)
Increase (decrease) in comparable sales ......... 10% 7% (4%)
Warehouse openings, net ...................... 20 13 15
2011 vs. 2010
Net Sales
Net sales increased $10,793 or 14.2% during 2011 compared to 2010. Excluding sales of Mexico, the
increase would have been 11%. This increase was primarily attributable to an increase in comparable
warehouse sales, and the remainder primarily from sales at the 20 net new warehouses opened during
27