Costco 2011 Annual Report Download - page 12
Download and view the complete annual report
Please find page 12 of the 2011 Costco annual report below. You can navigate through the pages in the report by either clicking on the pages listed below, or by using the keyword search tool below to find specific information within the annual report.-
 1
1 -
 2
2 -
 3
3 -
 4
4 -
 5
5 -
 6
6 -
 7
7 -
 8
8 -
 9
9 -
 10
10 -
 11
11 -
 12
12 -
 13
13 -
 14
14 -
 15
15 -
 16
16 -
 17
17 -
 18
18 -
 19
19 -
 20
20 -
 21
21 -
 22
22 -
23
-
24
-
25
-
26
-
27
-
28
-
29
-
30
-
31
-
32
-
33
-
34
-
35
-
36
-
37
-
38
-
39
-
40
-
41
-
42
-
43
-
44
-
45
-
46
-
47
-
48
-
49
-
50
-
51
-
52
-
53
-
54
-
55
-
56
-
57
-
58
-
59
-
60
-
61
-
62
-
63
-
64
-
65
-
66
-
67
-
68
-
69
-
70
-
71
-
72
-
73
-
74
-
75
-
76
-
77
-
78
-
79
-
80
-
81
-
82
-
83
-
84
-
85
-
86
-
87
 |
 |

Only the 2011 data in the accompanying tables includes Mexico.
The following table indicates the approximate percentage of net sales accounted for by major category
of items:
2011 2010 2009
Sundries (including candy, snack foods, tobacco, alcoholic
and nonalcoholic beverages and cleaning and institutional
supplies) ......................................... 22% 23% 23%
Hardlines (including major appliances, electronics, health
and beauty aids, hardware, office supplies, cameras,
garden and patio, sporting goods, toys, seasonal items
and automotive supplies) ............................ 17% 18% 19%
Food (including dry and institutionally packaged foods) ..... 21% 21% 21%
Softlines (including apparel, domestics, jewelry,
housewares, media, home furnishings and small
appliances) ....................................... 10% 10% 10%
Fresh Food (including meat, bakery, deli and produce) .... 12% 12% 12%
Ancillary and Other (including gas stations, pharmacy, food
court, optical, one-hour photo, hearing aid and travel) .... 18% 16% 15%
Ancillary businesses within or next to our warehouses provide expanded products and services and
encourage members to shop more frequently. The following table indicates the number of ancillary
businesses in operation at fiscal year-end:
2011 2010 2009
Food Court ......................................... 586 534 521
One-Hour Photo Centers .............................. 581 530 518
Optical Dispensing Centers ............................ 574 523 509
Pharmacies ........................................ 529 480 464
Gas Stations ........................................ 368 343 323
Hearing-Aid Centers ................................. 427 357 303
Print Shops and Copy Centers ......................... 10 10 10
Car Washes ........................................ 7 7 2
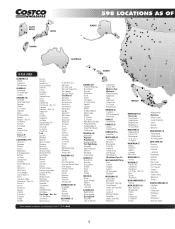
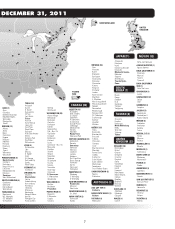
Number of warehouses ............................... 592 540 527
The 2010 and 2009 numbers exclude the 32 warehouses operated in Mexico.
Our electronic commerce businesses, costco.com in the U.S. and costco.ca in Canada, provide our
members additional products generally not found in our warehouses, in addition to services such as
digital photo processing, pharmacy, travel, and membership services.
Our warehouses accept cash, checks, certain debit cards, American Express and a private label
Costco credit card. Losses associated with dishonored checks have been minimal, as members who
have issued dishonored checks are identified and prevented from making further purchases until
restitution is made.
We have direct buying relationships with many producers of national brand-name merchandise. We do
not obtain a significant portion of merchandise from any one supplier. We have not experienced any
difficulty in obtaining sufficient quantities of merchandise, and believe that if one or more of our current
sources of supply became unavailable, we would be able to obtain alternative sources without
10