Costco 2011 Annual Report Download - page 25
Download and view the complete annual report
Please find page 25 of the 2011 Costco annual report below. You can navigate through the pages in the report by either clicking on the pages listed below, or by using the keyword search tool below to find specific information within the annual report.-
 1
1 -
2
-
3
-
4
-
5
-
6
-
7
-
8
-
9
-
10
-
11
-
12
-
13
-
14
-
 15
15 -
 16
16 -
 17
17 -
 18
18 -
 19
19 -
 20
20 -
 21
21 -
 22
22 -
 23
23 -
 24
24 -
 25
25 -
 26
26 -
 27
27 -
 28
28 -
 29
29 -
 30
30 -
 31
31 -
 32
32 -
 33
33 -
 34
34 -
 35
35 -
36
-
37
-
38
-
39
-
40
-
41
-
42
-
43
-
44
-
45
-
46
-
47
-
48
-
49
-
50
-
51
-
52
-
53
-
54
-
55
-
56
-
57
-
58
-
59
-
60
-
61
-
62
-
63
-
64
-
65
-
66
-
67
-
68
-
69
-
70
-
71
-
72
-
73
-
74
-
75
-
76
-
77
-
78
-
79
-
80
-
81
-
82
-
83
-
84
-
85
-
86
-
87
 |
 |

MARKET FOR COSTCO COMMON STOCK
Market Information and Dividend Policy
Our common stock is traded on the National Market tier of NASDAQ under the symbol “COST.” On
September 30, 2011, we had 8,198 stockholders of record.
The following table shows the quarterly high and low closing sale prices as reported by NASDAQ for
each quarter during the last two fiscal years and the quarterly cash dividend declared per share of our
common stock during the periods indicated.
Price Range Cash
Dividends
DeclaredHigh Low
2011:
Fourth Quarter ........................................... $83.86 $70.39 $0.240
Third Quarter ............................................ 81.46 69.76 0.240
Second Quarter .......................................... 75.04 66.90 0.205
First Quarter ............................................. 67.02 56.07 0.205
2010:
Fourth Quarter ........................................... 59.16 53.61 0.205
Third Quarter ............................................ 61.74 57.31 0.205
Second Quarter .......................................... 60.89 57.07 0.180
First Quarter ............................................. 61.12 50.65 0.180
Payment of future dividends is subject to declaration by the Board of Directors. Factors considered in
determining the size of the dividends are our profitability and expected capital needs. Subject to these
qualifications, we presently expect to continue to pay dividends on a quarterly basis.
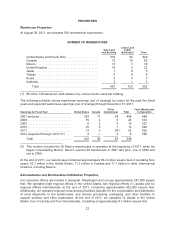
Issuer Purchases of Equity Securities (dollars in millions, except per share data)
The following table sets forth information on our common stock repurchase program activity for the
16-week fourth quarter of fiscal 2011:
Period(1)
Total
Number
of Shares
Purchased
Average
Price Paid
per Share
Total Number of
Shares
Purchased as
Part of Publicly
Announced
Programs(2)
Maximum Dollar
Value of Shares
that May Yet be
Purchased Under
the Programs(2)
May 9, 2011 – June 5, 2011 .............. 70,000 $79.16 70,000 $3,994
June 6, 2011 – July 3, 2011 .............. 1,052,000 79.56 1,052,000 $3,911
July 4, 2011 – July 31, 2011 .............. 917,000 80.64 917,000 $3,837
August 1, 2011 – August 28, 2011 ......... 1,756,000 74.85 1,756,000 $3,706
Total fourth quarter .................. 3,795,000 $77.63 3,795,000
(1) Monthly information is presented by reference to our fiscal periods during the fourth quarter of
fiscal 2011.
(2) Our stock repurchase program is conducted under a $4,000 authorization of our Board of
Directors approved in April 2011, which expires in April 2015.
Equity Compensation Plans
Information related to our equity compensation plans is incorporated herein by reference to the Proxy
Statement. The Proxy Statement was filed with the SEC within 120 days of the end of our fiscal year.
23