Costco 2011 Annual Report Download - page 27
Download and view the complete annual report
Please find page 27 of the 2011 Costco annual report below. You can navigate through the pages in the report by either clicking on the pages listed below, or by using the keyword search tool below to find specific information within the annual report.-
 1
1 -
2
-
3
-
4
-
5
-
6
-
7
-
8
-
9
-
10
-
11
-
12
-
13
-
14
-
15
-
16
-
 17
17 -
 18
18 -
 19
19 -
 20
20 -
 21
21 -
 22
22 -
 23
23 -
 24
24 -
 25
25 -
 26
26 -
 27
27 -
 28
28 -
 29
29 -
 30
30 -
 31
31 -
 32
32 -
 33
33 -
 34
34 -
 35
35 -
 36
36 -
 37
37 -
38
-
39
-
40
-
41
-
42
-
43
-
44
-
45
-
46
-
47
-
48
-
49
-
50
-
51
-
52
-
53
-
54
-
55
-
56
-
57
-
58
-
59
-
60
-
61
-
62
-
63
-
64
-
65
-
66
-
67
-
68
-
69
-
70
-
71
-
72
-
73
-
74
-
75
-
76
-
77
-
78
-
79
-
80
-
81
-
82
-
83
-
84
-
85
-
86
-
87
 |
 |

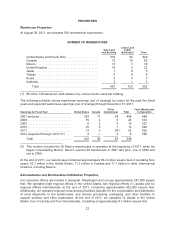
At the beginning of fiscal 2011, we began consolidating our 50% owned Mexico joint venture (Mexico)
on a prospective basis due to the adoption of a new accounting standard. Mexico’s results for the prior
years were accounted for under the equity method and our 50% share was included in “interest income
and other” in the consolidated statements of income. In the current year, the financial position and
results of Mexico’s operations are fully consolidated and the joint venture partner’s 50% share is
included in “net income attributable to noncontrolling interests” in the consolidated statements of
income of this Report. The initial consolidation of Mexico increased total assets, liabilities, and revenue
by approximately 3%, with no impact on net income or net income per common share attributable to
Costco. See discussion in Note 1 to the consolidated financial statements included in this Report.
SELECTED FINANCIAL DATA
(dollars in millions, except per share and warehouse number data)
As of and for the year ended
Aug. 28, 2011
(52 weeks)
Aug. 29, 2010
(52 weeks)
Aug. 30, 2009
(52 weeks)
Aug. 31, 2008
(52 weeks)
Sept. 2, 2007
(52 weeks)
RESULTS OF OPERATIONS
Net sales .............. $87,048 $76,255 $69,889 $70,977 $63,088
Merchandise costs ...... 77,739 67,995 62,335 63,503 56,450
Gross margin ....... 9,309 8,260 7,554 7,474 6,638
Membership fees ........ 1,867 1,691 1,533 1,506 1,313
Operating income ....... 2,439 2,077 1,777 1,969 1,609
Net income attributable to
Costco .............. 1,462 1,303 1,086 1,283 1,083
Net income per diluted
common share
attributable to Costco . . 3.30 2.92 2.47 2.89 2.37
Dividends per share ..... $ 0.89 $ 0.77 $ 0.68 $ 0.61 $ 0.55
Increase (decrease) in
comparable warehouse
sales(1)
United States ........... 7% 4% (2%) 6% 5%
International ............ 16% 19% (8%) 15% 9%
Total .................. 10% 7% (4%) 8% 6%
Increase in international
comparable warehouse
sales in local currency ..... 10% 8% 7% 6% 5%
BALANCE SHEET DATA
Net property and
equipment ........... $12,432 $11,314 $10,900 $10,355 $ 9,520
Total assets ............ 26,761 23,815 21,979 20,682 19,607
Short-term borrowings . . . — 26 16 134 54
Current portion of long-
term debt ............ 900 — 80 6 60
Long-term debt, excluding
current portion ........ 1,253 2,141 2,130 2,206 2,108
Costco stockholders’
equity ............... $12,002 $10,829 $10,024 $ 9,194 $ 8,626
WAREHOUSE INFORMATION
Warehouses in Operation(2)
Beginning of year(2) ..... 572 527 512 488 458
Opened(3) ............. 24 14 19 34 30
Closed(3) .............. (4) (1) (4) (10) —
End of year ............. 592 540 527 512 488
(1) Includes net sales at warehouses open greater than one year, including relocated facilities.
(2) Excludes, in 2010 and in prior years presented, warehouses operated in Mexico through a 50% owned joint venture. Mexico
opened 30 of these warehouses in 2007 and prior, one in 2008, and one in 2009. The 2011 beginning-of-year figure
includes the 32 Mexico warehouses consolidated at the beginning of the fiscal year.
(3) Includes warehouse relocations and the closure in July 2009 of two Costco Home locations.
25