Costco 2011 Annual Report Download - page 65
Download and view the complete annual report
Please find page 65 of the 2011 Costco annual report below. You can navigate through the pages in the report by either clicking on the pages listed below, or by using the keyword search tool below to find specific information within the annual report.-
 1
1 -
2
-
3
-
4
-
5
-
6
-
7
-
8
-
9
-
10
-
11
-
12
-
13
-
14
-
15
-
16
-
17
-
18
-
19
-
20
-
21
-
22
-
23
-
24
-
25
-
26
-
27
-
28
-
29
-
30
-
31
-
32
-
33
-
34
-
35
-
36
-
37
-
38
-
39
-
40
-
41
-
42
-
43
-
44
-
45
-
46
-
47
-
48
-
49
-
50
-
51
-
52
-
53
-
54
-
 55
55 -
 56
56 -
 57
57 -
 58
58 -
 59
59 -
 60
60 -
 61
61 -
 62
62 -
 63
63 -
 64
64 -
 65
65 -
 66
66 -
 67
67 -
 68
68 -
 69
69 -
 70
70 -
 71
71 -
 72
72 -
 73
73 -
 74
74 -
 75
75 -
76
-
77
-
78
-
79
-
80
-
81
-
82
-
83
-
84
-
85
-
86
-
87
 |
 |

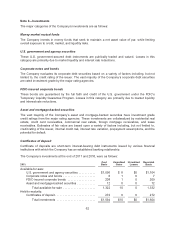
2010:
Cost
Basis
Unrealized
Gains
Unrealized
Losses
Recorded
Basis
Available-for-sale:
U.S. government and agency securities ........... $1,222 $7 $0 $1,229
Corporate notes and bonds ..................... 10 1 0 11
FDIC-insured corporate bonds .................. 139 0 0 139
Asset and mortgage-backed securities ............ 23 0 0 23
Total available-for-sale ..................... 1,394 8 0 1,402
Held-to-maturity:
Certificates of deposit .......................... 133 0 0 133
Total investments ......................... $1,527 $8 $0 $1,535
Gross unrealized gains and losses on cash equivalents were not material at August 28, 2011 and
August 29, 2010.
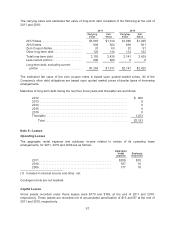
The proceeds and gross realized gains and losses from sales of available-for-sale securities during
2011, 2010, and 2009 are provided in the following table:
2011 2010 2009
Proceeds .......................................... $602 $309 $183
Realized gains ...................................... 1 5 5
Realized losses ..................................... 0 1 2
During 2009, the Company recognized $12 other-than-temporary impairment losses related to certain
enhanced money fund investment securities, which were included in interest income and other, net in
the accompanying consolidated statements of income. At the end of 2010, the Company no longer
held any of these securities. At the end of 2011 and 2010 the Company’s available-for-sale securities
that were in continuous unrealized-loss position were insignificant.
The maturities of available-for-sale and held-to-maturity securities at August 28, 2011 were as follows:
Available-For-Sale Held-To-Maturity
Cost Basis Fair Value Cost Basis Fair Value
Due in one year or less ............................ $ 890 $ 892 $272 $272
Due after one year through five years ................ 426 433 0 0
Due after five years ............................... 6 7 0 0
Total .................................... $1,322 $1,332 $272 $272
63