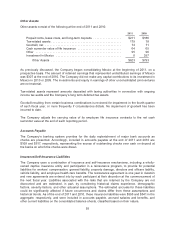
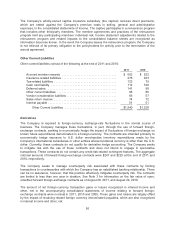
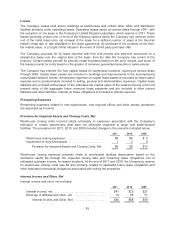
Costco 2011 Annual Report Download - page 53
Download and view the complete annual report
Please find page 53 of the 2011 Costco annual report below. You can navigate through the pages in the report by either clicking on the pages listed below, or by using the keyword search tool below to find specific information within the annual report.-
 1
1 -
2
-
3
-
4
-
5
-
6
-
7
-
8
-
9
-
10
-
11
-
12
-
13
-
14
-
15
-
16
-
17
-
18
-
19
-
20
-
21
-
22
-
23
-
24
-
25
-
26
-
27
-
28
-
29
-
30
-
31
-
32
-
33
-
34
-
35
-
36
-
37
-
38
-
39
-
40
-
41
-
42
-
 43
43 -
 44
44 -
 45
45 -
 46
46 -
 47
47 -
 48
48 -
 49
49 -
 50
50 -
 51
51 -
 52
52 -
 53
53 -
 54
54 -
 55
55 -
 56
56 -
 57
57 -
 58
58 -
 59
59 -
 60
60 -
 61
61 -
 62
62 -
 63
63 -
64
-
65
-
66
-
67
-
68
-
69
-
70
-
71
-
72
-
73
-
74
-
75
-
76
-
77
-
78
-
79
-
80
-
81
-
82
-
83
-
84
-
85
-
86
-
87
 |
 |
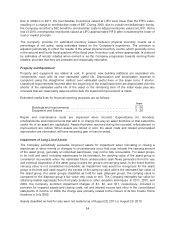
Use of Estimates
The preparation of financial statements in conformity with U.S. generally accepted accounting
principles (GAAP) requires management to make estimates and assumptions that affect the reported
amounts of assets and liabilities and the disclosure of contingent assets and liabilities at the date of the
financial statements and the reported amounts of revenues and expenses during the reporting period.
Actual results could differ from those estimates and assumptions.
Reclassifications
Certain reclassifications have been made to prior fiscal year amounts or balances to conform to the
presentation in the current fiscal year. These reclassifications did not have a material impact on the
Company’s previously reported consolidated financial statements.
Cash and Cash Equivalents
The Company considers as cash and cash equivalents all highly liquid investments with a maturity of
three months or less at the date of purchase and proceeds due from credit and debit card transactions
with settlement terms of less than one week. Credit and debit card receivables were $982 and $862 at
the end of 2011 and 2010, respectively.
Short-term Investments
In general, short-term investments have a maturity of three months to five years at the date of
purchase. Investments with maturities beyond five years may be classified, based on the Company’s
determination, as short-term based on their highly liquid nature and because such marketable
securities represent the investment of cash that is available for current operations. Short-term
investments classified as available-for-sale are recorded at fair value using the specific identification
method with the unrealized gains and losses reflected in accumulated other comprehensive income
until realized. Realized gains and losses from the sale of available-for-sale securities, if any, are
determined on a specific identification basis and all are recorded in interest income and other, net in
the consolidated statements of income. Short-term investments classified as held-to-maturity are
financial instruments that the Company has the intent and ability to hold to maturity and are reported
net of any related amortization and are not remeasured to fair value on a recurring basis.
Fair Value of Financial Instruments
The carrying value of the Company’s financial instruments, including cash and cash equivalents,
receivables, and accounts payable approximate fair value due to their short-term nature or variable
interest rates. See Notes 2, 3, and 4 for the carrying value and fair value of the Company’s
investments, derivative instruments, and fixed rate debt.
The Company follows the authoritative guidance for fair value measurements relating to financial and
nonfinancial assets and liabilities, including the presentation of required disclosures, in its consolidated
financial statements. This guidance defines fair value as the price that would be received to sell an
asset or paid to transfer a liability (an exit price) in an orderly transaction between market participants
at the measurement date. The guidance also establishes a fair value hierarchy, which requires
maximizing the use of observable inputs when measuring fair value. The three levels of inputs that may
be used are:
Level 1: Quoted market prices in active markets for identical assets or liabilities.
Level 2: Observable market based inputs or unobservable inputs that are corroborated by
market data.
Level 3: Significant unobservable inputs that are not corroborated by market data.
51