Costco 2011 Annual Report Download - page 26
Download and view the complete annual report
Please find page 26 of the 2011 Costco annual report below. You can navigate through the pages in the report by either clicking on the pages listed below, or by using the keyword search tool below to find specific information within the annual report.-
 1
1 -
2
-
3
-
4
-
5
-
6
-
7
-
8
-
9
-
10
-
11
-
12
-
13
-
14
-
15
-
 16
16 -
 17
17 -
 18
18 -
 19
19 -
 20
20 -
 21
21 -
 22
22 -
 23
23 -
 24
24 -
 25
25 -
 26
26 -
 27
27 -
 28
28 -
 29
29 -
 30
30 -
 31
31 -
 32
32 -
 33
33 -
 34
34 -
 35
35 -
 36
36 -
37
-
38
-
39
-
40
-
41
-
42
-
43
-
44
-
45
-
46
-
47
-
48
-
49
-
50
-
51
-
52
-
53
-
54
-
55
-
56
-
57
-
58
-
59
-
60
-
61
-
62
-
63
-
64
-
65
-
66
-
67
-
68
-
69
-
70
-
71
-
72
-
73
-
74
-
75
-
76
-
77
-
78
-
79
-
80
-
81
-
82
-
83
-
84
-
85
-
86
-
87
 |
 |
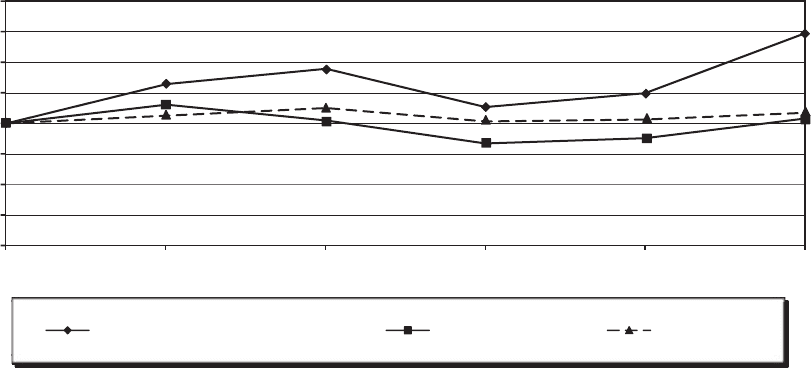
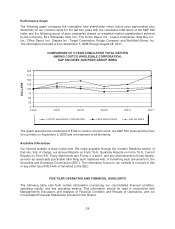
Performance Graph
The following graph compares the cumulative total shareholder return (stock price appreciation plus
dividends) on our common stock for the last five years with the cumulative total return of the S&P 500
Index and the following group of peer companies (based on weighted market capitalization) selected
by the Company: BJ’s Wholesale Club, Inc.; The Home Depot, Inc.; Lowe’s Companies; Best Buy Co.,
Inc.; Office Depot, Inc.; Staples Inc.; Target Corporation; Kroger Company; and Wal-Mart Stores, Inc.
The information provided is from September 3, 2006 through August 28, 2011.
COMPARISON OF 5-YEAR CUMULATIVE TOTAL RETURN
AMONG COSTCO WHOLESALE CORPORATION,
S&P 500 INDEX AND PEER GROUP INDEX
0
25
50
75
100
125
150
175
200
9/03/06 9/02/07 8/31/08 8/30/09 8/29/10 8/28/11
DOLLARS
COSTCO WHOLESALE CORPORATION PEER GROUP INDEX S&P 500 INDEX
The graph assumes the investment of $100 in Costco common stock, the S&P 500 Index and the Peer
Group Index on September 3, 2006 and reinvestment of all dividends.
Available Information
Our internet website is www.costco.com. We make available through the Investor Relations section of
that site, free of charge, our Annual Reports on Form 10-K, Quarterly Reports on Form 10-Q, Current
Reports on Form 8-K, Proxy Statements and Forms 3, 4 and 5, and any amendments to those reports,
as soon as reasonably practicable after filing such materials with, or furnishing such documents to, the
Securities and Exchange Commission (SEC). The information found on our website is not part of this
or any other report filed with or furnished to the SEC.
FIVE YEAR OPERATING AND FINANCIAL HIGHLIGHTS
The following table sets forth certain information concerning our consolidated financial condition,
operating results, and key operating metrics. This information should be read in conjunction with
Management’s Discussion and Analysis of Financial Condition and Results of Operations, and our
Consolidated Financial Statements included in this Report.
24