Costco 2011 Annual Report Download - page 69
Download and view the complete annual report
Please find page 69 of the 2011 Costco annual report below. You can navigate through the pages in the report by either clicking on the pages listed below, or by using the keyword search tool below to find specific information within the annual report.-
 1
1 -
2
-
3
-
4
-
5
-
6
-
7
-
8
-
9
-
10
-
11
-
12
-
13
-
14
-
15
-
16
-
17
-
18
-
19
-
20
-
21
-
22
-
23
-
24
-
25
-
26
-
27
-
28
-
29
-
30
-
31
-
32
-
33
-
34
-
35
-
36
-
37
-
38
-
39
-
40
-
41
-
42
-
43
-
44
-
45
-
46
-
47
-
48
-
49
-
50
-
51
-
52
-
53
-
54
-
55
-
56
-
57
-
58
-
 59
59 -
 60
60 -
 61
61 -
 62
62 -
 63
63 -
 64
64 -
 65
65 -
 66
66 -
 67
67 -
 68
68 -
 69
69 -
 70
70 -
 71
71 -
 72
72 -
 73
73 -
 74
74 -
 75
75 -
 76
76 -
 77
77 -
 78
78 -
 79
79 -
80
-
81
-
82
-
83
-
84
-
85
-
86
-
87
 |
 |

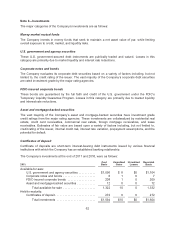
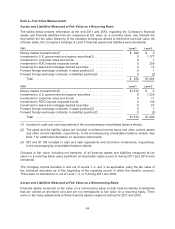
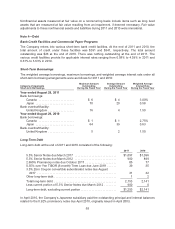
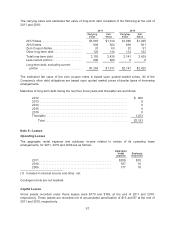
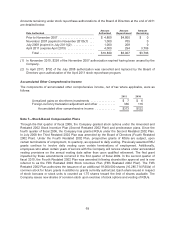
The carrying value and estimated fair value of long-term debt consisted of the following at the end of
2011 and 2010:
2011 2010
Carrying
Value
Fair
Value
Carrying
Value
Fair
Value
2017 Notes ......................... $1,097 $1,314 $1,096 $1,295
2012 Notes ......................... 900 924 899 961
Zero Coupon Notes ................... 31 63 32 51
Other long-term debt .................. 125 134 114 122
Total long-term debt .................. 2,153 2,435 2,141 2,429
Less current portion .................. 900 924 0 0
Long-term debt, excluding current
portion ........................... $1,253 $1,511 $2,141 $2,429
The estimated fair value of the zero coupon notes is based upon quoted market prices. All of the
Company’s other debt obligations are based upon quoted market prices of similar types of borrowing
arrangements.
Maturities of long-term debt during the next five fiscal years and thereafter are as follows:
2012 ........................................................ $ 900
2013 ........................................................ 0
2014 ........................................................ 0
2015 ........................................................ 0
2016 ........................................................ 0
Thereafter ................................................... 1,253
Total .................................................... $2,153
Note 5—Leases
Operating Leases
The aggregate rental expense and sublease income related to certain of its operating lease
arrangements, for 2011, 2010 and 2009 are as follows:
Aggregate
rental
expense
Sublease
income(1)
2011 .............................................. $208 $10
2010 .............................................. 187 10
2009 .............................................. 177 10
(1) Included in interest income and other, net
Contingent rents are not material.
Capital Leases
Gross assets recorded under these leases were $170 and $169, at the end of 2011 and 2010,
respectively. These assets are recorded net of accumulated amortization of $13 and $7 at the end of
2011 and 2010, respectively.
67