Costco 2009 Annual Report Download - page 82
Download and view the complete annual report
Please find page 82 of the 2009 Costco annual report below. You can navigate through the pages in the report by either clicking on the pages listed below, or by using the keyword search tool below to find specific information within the annual report.-
 1
1 -
2
-
3
-
4
-
5
-
6
-
7
-
8
-
9
-
10
-
11
-
12
-
13
-
14
-
15
-
16
-
17
-
18
-
19
-
20
-
21
-
22
-
23
-
24
-
25
-
26
-
27
-
28
-
29
-
30
-
31
-
32
-
33
-
34
-
35
-
36
-
37
-
38
-
39
-
40
-
41
-
42
-
43
-
44
-
45
-
46
-
47
-
48
-
49
-
50
-
51
-
52
-
53
-
54
-
55
-
56
-
57
-
58
-
59
-
60
-
61
-
62
-
63
-
64
-
65
-
66
-
67
-
68
-
69
-
70
-
71
-
 72
72 -
 73
73 -
 74
74 -
 75
75 -
 76
76 -
 77
77 -
 78
78 -
 79
79 -
 80
80 -
 81
81 -
 82
82 -
 83
83 -
 84
84 -
 85
85 -
 86
86 -
 87
87 -
 88
88 -
 89
89 -
 90
90 -
 91
91 -
 92
92 -
93
-
94
-
95
-
96
 |
 |

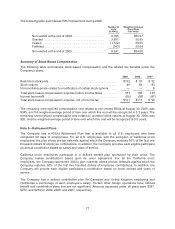
The components of the deferred tax assets and liabilities are as follows:
2009 2008
Stock options ..................................................... $117 $ 98
Deferred income/membership fees ................................... 94 62
Excess foreign tax credits .......................................... — 4
Accrued liabilities and reserves ...................................... 408 431
Other ........................................................... 48 59
Total deferred tax assets ....................................... 667 654
Property and equipment ............................................ 403 351
Merchandise inventories ............................................ 184 146
Translation gain ................................................... — 5
Total deferred tax liabilities ...................................... 587 502
Net deferred tax assets ............................................ $ 80 $152
The deferred tax accounts at the end of 2009 and 2008 include current deferred income tax assets of
$247 and $261, respectively, included in deferred income taxes and other current assets; non-current
deferred income tax assets of $7 and $5, respectively, included in other assets; current deferred
income tax liabilities of $0 and $1, respectively, included in other current liabilities; and non-current
deferred income tax liabilities of $174 and $114, respectively, included in deferred income taxes and
other liabilities.
The effective income tax rate on earnings was 36.7% in 2009, 35.8% in 2008, and 36.7% in 2007.
During 2008 and 2007, the Company distributed $104 and $120 respectively in earnings from its
Canadian operations. In 2009, the distribution was not material.
The Company has not provided for U.S. deferred taxes on cumulative undistributed earnings of certain
non-U.S. affiliates, including its 50% owned investment in the Mexico corporate joint venture,
aggregating $1,554 and $1,235 at the end of 2009 and 2008, respectively, as such earnings are
deemed indefinitely reinvested. Because of the availability of U.S. foreign tax credits and complexity of
the computation, it is not practicable to determine the U.S. federal income tax liability or benefit
associated with such earnings if such earnings were not deemed to be indefinitely reinvested.
80