Costco 2009 Annual Report Download - page 29
Download and view the complete annual report
Please find page 29 of the 2009 Costco annual report below. You can navigate through the pages in the report by either clicking on the pages listed below, or by using the keyword search tool below to find specific information within the annual report.-
 1
1 -
2
-
3
-
4
-
5
-
6
-
7
-
8
-
9
-
10
-
11
-
12
-
13
-
14
-
15
-
16
-
17
-
18
-
 19
19 -
 20
20 -
 21
21 -
 22
22 -
 23
23 -
 24
24 -
 25
25 -
 26
26 -
 27
27 -
 28
28 -
 29
29 -
 30
30 -
 31
31 -
 32
32 -
 33
33 -
 34
34 -
 35
35 -
 36
36 -
 37
37 -
 38
38 -
 39
39 -
40
-
41
-
42
-
43
-
44
-
45
-
46
-
47
-
48
-
49
-
50
-
51
-
52
-
53
-
54
-
55
-
56
-
57
-
58
-
59
-
60
-
61
-
62
-
63
-
64
-
65
-
66
-
67
-
68
-
69
-
70
-
71
-
72
-
73
-
74
-
75
-
76
-
77
-
78
-
79
-
80
-
81
-
82
-
83
-
84
-
85
-
86
-
87
-
88
-
89
-
90
-
91
-
92
-
93
-
94
-
95
-
96
 |
 |

We believe disclosing the effects of these items helps provide a meaningful comparison of our current
year results to prior years. The impact of each of these items noted above is presented below:
2007
Sales return
reserve
Employee tax
consequences on
stock options
Deferred
membership
Excise tax
refund Total
Net sales ......................... $(452) $ — $ — $— $(452)
Membership fees ................... — — (56) — (56)
Total revenue .................. (452) — (56) — (508)
Merchandise costs ................. 358 — — 9 367
Gross margin(1) ................ (94) — — 9 (85)
SG&A ............................ — (47) — — (47)
Operating income............... (94) (47) (56) 9 (188)
Interest expense ................... — — — — —
Interest income and other ............ (1) — — 1 —
Income before income taxes ......... (95) (47) (56) 10 (188)
Provision for income taxes ....... 35 17 21 (4) 69
Net Income ........................ $ (60) $(30) $(35) $ 6 $(119)
(1) Net sales less merchandise costs.
Results of Operations
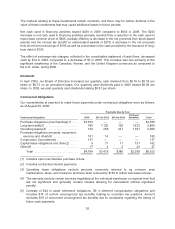
Net Sales
2009 2008 2007
Net sales .................................... $69,889 $70,977 $63,088
Effect of change in estimated sales returns
reserve ................................... — — 452
Net sales, as adjusted ......................... $69,889 $70,977 $63,540
Net sales (decrease) increase .................. (1.5)% 12.5% 7.0%
Net sales (decrease) increase, as adjusted ........ (1.5)% 11.7% 7.8%
Increase (decrease) in comparable warehouse
sales ..................................... (4)% 8% 6%
Warehouse openings, net ...................... 15 24 30
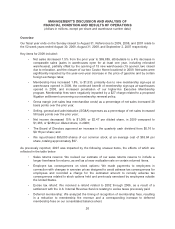
2009 vs. 2008
Net Sales
Our 2009 sales results, particularly in hardlines and softlines, were negatively impacted by general
economic conditions, and we believe that those conditions may continue to have a significant adverse
impact on spending by our members. We believe, however, that due to the nature of our business
model, we are better positioned than many retailers to compete in such an environment.
Net sales decreased 1.5% during 2009 compared to 2008. The $1,088 decrease was comprised of a
$2,590 decrease in comparable sales, partially offset by an increase of $1,502 primarily from sales at
new warehouses opened during 2009 and 2008. Our sales were also impacted by a lower number of
warehouse openings year-over-year.
27