Costco 2009 Annual Report Download - page 25
Download and view the complete annual report
Please find page 25 of the 2009 Costco annual report below. You can navigate through the pages in the report by either clicking on the pages listed below, or by using the keyword search tool below to find specific information within the annual report.-
 1
1 -
2
-
3
-
4
-
5
-
6
-
7
-
8
-
9
-
10
-
11
-
12
-
13
-
14
-
 15
15 -
 16
16 -
 17
17 -
 18
18 -
 19
19 -
 20
20 -
 21
21 -
 22
22 -
 23
23 -
 24
24 -
 25
25 -
 26
26 -
 27
27 -
 28
28 -
 29
29 -
 30
30 -
 31
31 -
 32
32 -
 33
33 -
 34
34 -
 35
35 -
36
-
37
-
38
-
39
-
40
-
41
-
42
-
43
-
44
-
45
-
46
-
47
-
48
-
49
-
50
-
51
-
52
-
53
-
54
-
55
-
56
-
57
-
58
-
59
-
60
-
61
-
62
-
63
-
64
-
65
-
66
-
67
-
68
-
69
-
70
-
71
-
72
-
73
-
74
-
75
-
76
-
77
-
78
-
79
-
80
-
81
-
82
-
83
-
84
-
85
-
86
-
87
-
88
-
89
-
90
-
91
-
92
-
93
-
94
-
95
-
96
 |
 |

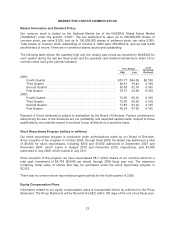
MARKET FOR COSTCO COMMON STOCK
Market Information and Dividend Policy
Our common stock is traded on the National Market tier of the NASDAQ Global Select Market
(“NASDAQ”) under the symbol “COST.” We are authorized to issue up to 900,000,000 shares of
common stock, par value $.005, and up to 100,000,000 shares of preferred stock, par value $.005.
Total shares of common stock outstanding at October 2, 2009 were 435,989,212, and we had 8,459
stockholders of record. There are no preferred shares issued and outstanding
The following table shows the quarterly high and low closing sale prices as reported by NASDAQ for
each quarter during the last two fiscal years and the quarterly cash dividend declared per share of our
common stock during the periods indicated.
Price Range Cash
Dividends
DeclaredHigh Low
2009:
Fourth Quarter ............................................ $51.77 $44.54 $0.180
Third Quarter ............................................. 48.91 38.44 0.180
Second Quarter ........................................... 55.58 42.76 0.160
First Quarter .............................................. 70.37 44.99 0.160
2008:
Fourth Quarter ............................................ 74.66 60.35 0.160
Third Quarter ............................................. 72.65 60.04 0.160
Second Quarter ........................................... 71.83 63.24 0.145
First Quarter .............................................. 69.24 57.00 0.145
Payment of future dividends is subject to declaration by the Board of Directors. Factors considered in
determining the size of the dividends are our profitability and expected capital needs. Subject to these
qualifications, we presently expect to continue to pay dividends on a quarterly basis.
Stock Repurchase Program (dollars in millions)
Our stock repurchase program is conducted under authorizations made by our Board of Directors.
Since inception of the program in October 2004, through fiscal 2009, the Board has authorized a total
of $6,800 for stock repurchases, including $300 and $1,000 authorized in September 2007 and
November 2007, which expire in August 2010 and November 2010, respectively, and $1,000
authorized in July 2008, which expires in July 2011.
Since inception of the program, we have repurchased 88.7 million shares of our common stock for a
total cash investment of $4,798 ($54.08 per share) through 2009 fiscal year end. The maximum
remaining dollar value of shares that may be purchased under the stock repurchase program is
$2,002.
There was no common stock repurchase program activity for the fourth quarter of 2009.
Equity Compensation Plans
Information related to our equity compensation plans is incorporated herein by reference to the Proxy
Statement. The Proxy Statement will be filed with the SEC within 120 days of the end of our fiscal year.
23