Costco 2009 Annual Report Download - page 27
Download and view the complete annual report
Please find page 27 of the 2009 Costco annual report below. You can navigate through the pages in the report by either clicking on the pages listed below, or by using the keyword search tool below to find specific information within the annual report.-
 1
1 -
2
-
3
-
4
-
5
-
6
-
7
-
8
-
9
-
10
-
11
-
12
-
13
-
14
-
15
-
16
-
 17
17 -
 18
18 -
 19
19 -
 20
20 -
 21
21 -
 22
22 -
 23
23 -
 24
24 -
 25
25 -
 26
26 -
 27
27 -
 28
28 -
 29
29 -
 30
30 -
 31
31 -
 32
32 -
 33
33 -
 34
34 -
 35
35 -
 36
36 -
 37
37 -
38
-
39
-
40
-
41
-
42
-
43
-
44
-
45
-
46
-
47
-
48
-
49
-
50
-
51
-
52
-
53
-
54
-
55
-
56
-
57
-
58
-
59
-
60
-
61
-
62
-
63
-
64
-
65
-
66
-
67
-
68
-
69
-
70
-
71
-
72
-
73
-
74
-
75
-
76
-
77
-
78
-
79
-
80
-
81
-
82
-
83
-
84
-
85
-
86
-
87
-
88
-
89
-
90
-
91
-
92
-
93
-
94
-
95
-
96
 |
 |

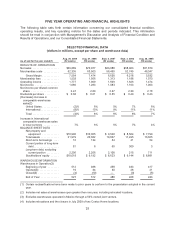
FIVE YEAR OPERATING AND FINANCIAL HIGHLIGHTS
The following table sets forth certain information concerning our consolidated financial condition,
operating results, and key operating metrics for the dates and periods indicated. This information
should be read in conjunction with Management’s Discussion and Analysis of Financial Condition and
Results of Operations, and our Consolidated Financial Statements.
SELECTED FINANCIAL DATA
(dollars in millions, except per share and warehouse data)
As of and for the year ended(1)
Aug. 30, 2009
(52 weeks)
Aug. 31, 2008
(52 weeks)
Sept. 2, 2007
(52 weeks)
Sept. 3, 2006
(53 weeks)
Aug. 28, 2005
(52 weeks)
RESULTS OF OPERATIONS
Net sales ................... $69,889 $70,977 $63,088 $58,963 $51,879
Merchandise costs ........... 62,335 63,503 56,450 52,745 46,347
Gross Margin ............ 7,554 7,474 6,638 6,218 5,532
Membership fees ............ 1,533 1,506 1,313 1,188 1,073
Operating income ............ 1,777 1,969 1,609 1,626 1,474
Net income ................. 1,086 1,283 1,083 1,103 1,063
Net income per diluted common
share .................... 2.47 2.89 2.37 2.30 2.18
Dividends per share .......... $ 0.68 $ 0.61 $ 0.55 $ 0.49 $ 0.43
(Decrease) increase in
comparable warehouse
sales(2)
United States ............ (2)% 6% 5% 7% 6%
International ............. (8)% 15% 9% 11% 11%
Total ................... (4)% 8% 6% 8% 7%
Increase in International
comparable warehouse sales
in local currency ........... 7% 6% 5% 7% 4%
BALANCE SHEET DATA
Net property and
equipment ............ $10,900 $10,355 $ 9,520 $ 8,564 $ 7,790
Total assets ............. 21,979 20,682 19,607 17,495 16,665
Short-term borrowings .... 16 134 54 41 54
Current portion of long-term
debt .................. 81 6 60 309 3
Long-term debt, excluding
current portion ......... 2,206 2,206 2,108 215 711
Stockholders’ equity ...... $10,018 $ 9,192 $ 8,623 $ 9,144 $ 8,881
WAREHOUSE INFORMATION
Warehouses in Operation(3)
Beginning of year ........ 512 488 458 433 417
Opened(4) .............. 19 34 30 28 21
Closed(4) ............... (4) (10) — (3) (5)
End of Year ............. 527 512 488 458 433
(1) Certain reclassifications have been made to prior years to conform to the presentation adopted in the current
year.
(2) Includes net sales at warehouses open greater than one year, including relocated locations.
(3) Excludes warehouses operated in Mexico through a 50% owned joint venture.
(4) Includes relocations and the closure in July 2009 of two Costco Home locations.
25