Costco 2009 Annual Report Download - page 37
Download and view the complete annual report
Please find page 37 of the 2009 Costco annual report below. You can navigate through the pages in the report by either clicking on the pages listed below, or by using the keyword search tool below to find specific information within the annual report.-
 1
1 -
2
-
3
-
4
-
5
-
6
-
7
-
8
-
9
-
10
-
11
-
12
-
13
-
14
-
15
-
16
-
17
-
18
-
19
-
20
-
21
-
22
-
23
-
24
-
25
-
26
-
 27
27 -
 28
28 -
 29
29 -
 30
30 -
 31
31 -
 32
32 -
 33
33 -
 34
34 -
 35
35 -
 36
36 -
 37
37 -
 38
38 -
 39
39 -
 40
40 -
 41
41 -
 42
42 -
 43
43 -
 44
44 -
 45
45 -
 46
46 -
 47
47 -
48
-
49
-
50
-
51
-
52
-
53
-
54
-
55
-
56
-
57
-
58
-
59
-
60
-
61
-
62
-
63
-
64
-
65
-
66
-
67
-
68
-
69
-
70
-
71
-
72
-
73
-
74
-
75
-
76
-
77
-
78
-
79
-
80
-
81
-
82
-
83
-
84
-
85
-
86
-
87
-
88
-
89
-
90
-
91
-
92
-
93
-
94
-
95
-
96
 |
 |

The markets relating to these investments remain uncertain, and there may be further declines in the
value of these investments that may cause additional losses in future periods.
Net cash used in financing activities totaled $439 in 2009 compared to $643 in 2008. The $204
decrease in net cash used in financing activities primarily resulted from a reduction in the cash used to
repurchase common stock of $826, partially offset by a decrease in the net proceeds from stock-based
awards and the excess tax benefit on share-based awards of $276, a decrease in the net proceeds
from short-term borrowings of $195 as well as a decrease in the cash provided by the issuance of long-
term debt of $103.
The effect of exchange rate changes, reflected in the consolidated statement of cash flows, decreased
cash by $14 in 2009, compared to a decrease of $7 in 2008. This increase was due primarily to the
significant weakening of the Canadian, Korean, and the United Kingdom currencies as compared to
the U.S. dollar, during 2009.
Dividends
In April 2009, our Board of Directors increased our quarterly cash dividend from $0.16 to $0.18 per
share or $0.72 on an annualized basis. Our quarterly cash dividends paid in 2009 totaled $0.68 per
share. In 2008, we paid quarterly cash dividends totaling $0.61 per share.
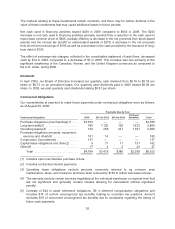
Contractual Obligations
Our commitments at year-end to make future payments under contractual obligations were as follows,
as of August 30, 2009:
Payments Due by Year
Contractual obligations 2010 2011 to 2012 2013 to 2014
2015 and
thereafter Total
Purchase obligations (merchandise)(1) .... $3,539 — — — $3,539
Long-term debt(2) ..................... 186 1,120 126 1,432 2,864
Operating leases(3) .................... 145 266 247 1,351 2,009
Purchase obligations (property, equipment,
services and other)(4) ................ 151 14 — — 165
Construction Commitments .............. 137 — — — 137
Capital lease obligations and other(2) ..... 9 11 11 131 162
Other(5) ............................. 17 4 2 24 47
Total ............................ $4,184 $1,415 $386 $2,938 $8,923
(1) Includes open merchandise purchase orders.
(2) Includes contractual interest payments.
(3) Operating lease obligations exclude amounts commonly referred to as common area
maintenance, taxes, and insurance and have been reduced by $163 to reflect sub-lease income.
(4) The amounts exclude certain services negotiated at the individual warehouse or regional level that
are not significant and generally contain clauses allowing for cancellation without significant
penalty.
(5) Consists of $24 in asset retirement obligations, $9 in deferred compensation obligations and
includes $14 of current unrecognized tax benefits relating to uncertain tax positions. Amount
excludes $16 of noncurrent unrecognized tax benefits due to uncertainty regarding the timing of
future cash payments.
35