Costco 2009 Annual Report Download - page 66
Download and view the complete annual report
Please find page 66 of the 2009 Costco annual report below. You can navigate through the pages in the report by either clicking on the pages listed below, or by using the keyword search tool below to find specific information within the annual report.-
 1
1 -
2
-
3
-
4
-
5
-
6
-
7
-
8
-
9
-
10
-
11
-
12
-
13
-
14
-
15
-
16
-
17
-
18
-
19
-
20
-
21
-
22
-
23
-
24
-
25
-
26
-
27
-
28
-
29
-
30
-
31
-
32
-
33
-
34
-
35
-
36
-
37
-
38
-
39
-
40
-
41
-
42
-
43
-
44
-
45
-
46
-
47
-
48
-
49
-
50
-
51
-
52
-
53
-
54
-
55
-
 56
56 -
 57
57 -
 58
58 -
 59
59 -
 60
60 -
 61
61 -
 62
62 -
 63
63 -
 64
64 -
 65
65 -
 66
66 -
 67
67 -
 68
68 -
 69
69 -
 70
70 -
 71
71 -
 72
72 -
 73
73 -
 74
74 -
 75
75 -
 76
76 -
77
-
78
-
79
-
80
-
81
-
82
-
83
-
84
-
85
-
86
-
87
-
88
-
89
-
90
-
91
-
92
-
93
-
94
-
95
-
96
 |
 |

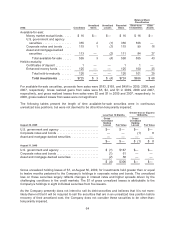
Balance Sheet
Classification
2008: Cost Basis
Unrealized
Gains
Unrealized
Losses
Recorded
Basis
Short-term
Investments
Other
Assets
Available-for-sale:
Money market mutual funds ..... $ 16 $— $— $ 16 $ 16 $—
U.S. government and agency
securities .................. 355 2 (1) 356 356 —
Corporate notes and bonds ..... 115 1 (1) 115 99 16
Asset and mortgage-backed
securities .................. 113 — (2) 111 84 27
Total available-for-sale ..... 599 3 (4) 598 555 43
Held-to-maturity:
Certificates of deposit .......... 1 — — 1 1 —
Enhanced money funds ........ 125 — — 125 100 25
Total held-to-maturity ...... 126 — — 126 101 25
Total investments ........ $725 $ 3 $ (4) $724 $656 $ 68
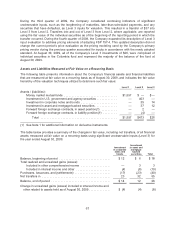
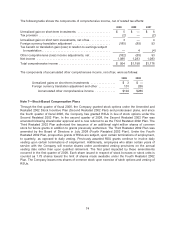
For available-for-sale securities, proceeds from sales were $183, $165, and $496 in 2009, 2008, and
2007, respectively. Gross realized gains from sales were $5, $2, and $1 in 2009, 2008 and 2007,
respectively, and gross realized losses from sales were $2 and $1 in 2009 and 2007, respectively. In
2008, gross realized losses from sales were not significant.
The following tables present the length of time available-for-sale securities were in continuous
unrealized loss positions, but were not deemed to be other-than-temporarily impaired:
Less than 12 Months
Greater than or Equal to
12 Months
August 30, 2009
Gross
Unrealized
Holding
Losses Fair Value
Gross
Unrealized
Holding
Losses Fair Value
U.S. government and agency ......................... $— $— $— $—
Corporate notes and bonds ........................... — — (1) 8
Asset and mortgage-backed securities ................. — — — —
$— $ — $ (1) $ 8
August 31, 2008
U.S. government and agency ......................... $ (1) $187 $— $—
Corporate notes and bonds ........................... (1) 61 — —
Asset and mortgage-backed securities ................. (2) 58 — —
$ (4) $306 $— $—
Gross unrealized holding losses of $1, at August 30, 2009, for investments held greater than or equal
to twelve months pertained to the Company’s holdings in corporate notes and bonds. The unrealized
loss on these securities largely reflects changes in interest rates and higher spreads driven by the
challenging conditions in the credit markets. The $1 of gross unrealized losses is attributable to the
Company’s holdings in eight individual securities from five issuers.
As the Company presently does not intend to sell its debt securities and believes that it is not more-
likely-than-not that it will be required to sell the securities that are in an unrealized loss position before
recovery of their amortized cost, the Company does not consider these securities to be other-than-
temporarily impaired.
64