Costco 2009 Annual Report Download - page 35
Download and view the complete annual report
Please find page 35 of the 2009 Costco annual report below. You can navigate through the pages in the report by either clicking on the pages listed below, or by using the keyword search tool below to find specific information within the annual report.-
 1
1 -
2
-
3
-
4
-
5
-
6
-
7
-
8
-
9
-
10
-
11
-
12
-
13
-
14
-
15
-
16
-
17
-
18
-
19
-
20
-
21
-
22
-
23
-
24
-
 25
25 -
 26
26 -
 27
27 -
 28
28 -
 29
29 -
 30
30 -
 31
31 -
 32
32 -
 33
33 -
 34
34 -
 35
35 -
 36
36 -
 37
37 -
 38
38 -
 39
39 -
 40
40 -
 41
41 -
 42
42 -
 43
43 -
 44
44 -
 45
45 -
46
-
47
-
48
-
49
-
50
-
51
-
52
-
53
-
54
-
55
-
56
-
57
-
58
-
59
-
60
-
61
-
62
-
63
-
64
-
65
-
66
-
67
-
68
-
69
-
70
-
71
-
72
-
73
-
74
-
75
-
76
-
77
-
78
-
79
-
80
-
81
-
82
-
83
-
84
-
85
-
86
-
87
-
88
-
89
-
90
-
91
-
92
-
93
-
94
-
95
-
96
 |
 |

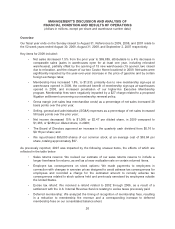
2008 vs. 2007
The decrease in interest income was largely due to lower interest rates, year-over-year, on our cash
and cash equivalents and short-term investment balances. In addition, we recognized $5 of other-than-
temporary impairment losses on certain securities within our investment portfolio. The increase in the
earnings of affiliates is primarily attributable to our investment in Costco Mexico (a 50%-owned joint
venture).
Provision for Income Taxes
2009 2008 2007
Income tax expense ........................... $628 $716 $627
Effective tax rate .............................. 36.7% 35.8% 36.7%
The lower tax rate in 2008 was primarily attributable to discrete benefits recognized during the year.
Net Income
2009 2008 2007
Net income ............................. $ 1,086 $ 1,283 $ 1,083
Unusual items (net of tax) ................. — — 119
Net income, as adjusted .................. $ 1,086 $ 1,283 $ 1,202
Diluted earnings per share ................ $ 2.47 $ 2.89 $ 2.37
Shares used to calculate diluted net income
per common share (000’s) .............. 440,454 444,240 457,641
Diluted earnings per share (decrease) /
increase ............................. (15)% 22% 3%
2009 vs. 2008
Net income for 2009 decreased to $1,086, or $2.47 per diluted share, from $1,283, or $2.89 per diluted
share, during 2008, representing a 15% decrease in diluted net income per share. As previously
discussed, foreign currencies, particularly in Canada, the United Kingdom and Korea, weakened
against the U.S. dollar, which negatively impacted net income for 2009 by approximately $83 after-tax,
or $0.19 per diluted share. Additionally, net income for 2009 was negatively impacted by a $34 pre-tax
charge, or approximately $0.05 per diluted share, related to a proposed litigation settlement concerning
our membership renewal policy, as well as a $23 pre-tax charge, or approximately $0.03 per diluted
share, for an adjustment to the net realizable value of the cash surrender value of employee life
insurance contracts. Net income for 2009 was positively impacted by a $32 pre-tax, or $0.05 per
diluted share, benefit due to the reversal of the LIFO reserve established in 2008.
2008 vs. 2007
Net income for 2008 increased to $1,283, or $2.89 per diluted share, from $1,083, or $2.37 per diluted
share, during 2007. The unusual items previously discussed totaled $119, net of tax, or $0.26 per
diluted share in 2007. Exclusive of these items, earnings in 2007 were $2.63 per diluted share. Net
income per diluted share in 2008 represents an increase of 10% over this adjusted amount. During
2008, we repurchased and retired 13,812,000 shares of common stock, favorably impacting earnings
per diluted share by approximately $0.03.
33