Costco 2009 Annual Report Download - page 53
Download and view the complete annual report
Please find page 53 of the 2009 Costco annual report below. You can navigate through the pages in the report by either clicking on the pages listed below, or by using the keyword search tool below to find specific information within the annual report.-
 1
1 -
2
-
3
-
4
-
5
-
6
-
7
-
8
-
9
-
10
-
11
-
12
-
13
-
14
-
15
-
16
-
17
-
18
-
19
-
20
-
21
-
22
-
23
-
24
-
25
-
26
-
27
-
28
-
29
-
30
-
31
-
32
-
33
-
34
-
35
-
36
-
37
-
38
-
39
-
40
-
41
-
42
-
 43
43 -
 44
44 -
 45
45 -
 46
46 -
 47
47 -
 48
48 -
 49
49 -
 50
50 -
 51
51 -
 52
52 -
 53
53 -
 54
54 -
 55
55 -
 56
56 -
 57
57 -
 58
58 -
 59
59 -
 60
60 -
 61
61 -
 62
62 -
 63
63 -
64
-
65
-
66
-
67
-
68
-
69
-
70
-
71
-
72
-
73
-
74
-
75
-
76
-
77
-
78
-
79
-
80
-
81
-
82
-
83
-
84
-
85
-
86
-
87
-
88
-
89
-
90
-
91
-
92
-
93
-
94
-
95
-
96
 |
 |

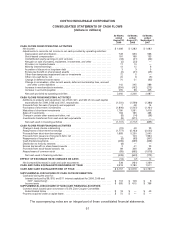
COSTCO WHOLESALE CORPORATION
CONSOLIDATED STATEMENTS OF CASH FLOWS
(dollars in millions)
52 Weeks
ended
August 30,
2009
52 Weeks
ended
August 31,
2008
52 Weeks
ended
September 2,
2007
CASH FLOWS FROM OPERATING ACTIVITIES
Net income ............................................................. $1,086 $ 1,283 $ 1,083
Adjustments to reconcile net income to net cash provided by operating activities:
Depreciation and amortization ............................................ 728 653 566
Stock-based compensation .............................................. 181 166 135
Undistributed equity earnings in joint ventures .............................. (33) (41) (34)
Net gain on sale of property, equipment, investments, and other ............... (2) (22) —
Provision on impaired assets ............................................. 11 10 —
Minority interest earnings ................................................ 13 12 6
Accretion of discount on long-term debt .................................... 3 3 3
Excess tax benefit on share based awards ................................. (2) (41) (25)
Other-than-temporary impairment loss on investments ........................ 12 5 —
Other non-cash items, net ............................................... 22 8 (5)
Change in deferred income taxes ......................................... 70 21 (93)
Change in receivables, other current assets, deferred membership fees, accrued
and other current liabilities ............................................. 142 245 289
Increase in merchandise inventories ....................................... (394) (192) (273)
Increase in accounts payable ............................................ 255 96 435
Net cash provided by operating activities ................................... 2,092 2,206 2,087
CASH FLOWS FROM INVESTING ACTIVITIES
Additions to property and equipment, net of $20, $21, and $42 of non-cash capital
expenditures for 2009, 2008 and 2007, respectively .......................... (1,250) (1,599) (1,386)
Proceeds from the sale of property and equipment ............................. 7 48 14
Purchases of short-term investments ........................................ (1,806) (1,507) (1,161)
Maturities of short-term investments ......................................... 1,780 1,561 1,418
Sales of investments ..................................................... 183 165 496
Change in certain other assets and other, net ................................. (9) (14) (36)
Investments transferred from cash and cash equivalents ........................ (6) (371) —
Net cash used in investing activities ....................................... (1,101) (1,717) (655)
CASH FLOWS FROM FINANCING ACTIVITIES
Change in bank checks outstanding ......................................... (22) 49 23
Repayments of short-term borrowings ....................................... (1,777) (5,163) (2,035)
Proceeds from short-term borrowings ........................................ 1,669 5,250 2,045
Proceeds from issuance of long-term debt, net ................................ — 103 1,994
Repayments of long-term debt ............................................. (6) (69) (307)
Cash dividend payments .................................................. (296) (265) (246)
Distribution to minority interests ............................................ (9) — —
Excess tax benefit on share based awards ................................... 2 41 25
Proceeds from stock-based awards, net ..................................... 69 306 304
Repurchases of common stock ............................................. (69) (895) (1,978)
Net cash used in financing activities ....................................... (439) (643) (175)
EFFECT OF EXCHANGE RATE CHANGES ON CASH .......................... (14) (7) 12
Net increase/(decrease) in cash and cash equivalents .......................... 538 (161) 1,269
CASH AND CASH EQUIVALENTS BEGINNING OF YEAR ...................... 2,619 2,780 1,511
CASH AND CASH EQUIVALENTS END OF YEAR ............................. $3,157 $ 2,619 $ 2,780
SUPPLEMENTAL DISCLOSURE OF CASH FLOW INFORMATION:
Cash paid during the year for:
Interest (reduced by $8, $16, and $11 interest capitalized for 2009, 2008 and
2007, respectively) ................................................... $ 104 $ 106 $ 9
Income taxes .......................................................... $ 565 $ 615 $ 786
SUPPLEMENTAL DISCLOSURE OF NON-CASH FINANCING ACTIVITIES:
Common stock issued upon conversion of 3.5% Zero Coupon Convertible
Subordinated Notes .................................................... $ 19 $ — $ 43
Property acquired under a capital lease ...................................... $ 72 $ — $ —
The accompanying notes are an integral part of these consolidated financial statements.
51