Costco 2009 Annual Report Download - page 36
Download and view the complete annual report
Please find page 36 of the 2009 Costco annual report below. You can navigate through the pages in the report by either clicking on the pages listed below, or by using the keyword search tool below to find specific information within the annual report.-
 1
1 -
2
-
3
-
4
-
5
-
6
-
7
-
8
-
9
-
10
-
11
-
12
-
13
-
14
-
15
-
16
-
17
-
18
-
19
-
20
-
21
-
22
-
23
-
24
-
25
-
 26
26 -
 27
27 -
 28
28 -
 29
29 -
 30
30 -
 31
31 -
 32
32 -
 33
33 -
 34
34 -
 35
35 -
 36
36 -
 37
37 -
 38
38 -
 39
39 -
 40
40 -
 41
41 -
 42
42 -
 43
43 -
 44
44 -
 45
45 -
 46
46 -
47
-
48
-
49
-
50
-
51
-
52
-
53
-
54
-
55
-
56
-
57
-
58
-
59
-
60
-
61
-
62
-
63
-
64
-
65
-
66
-
67
-
68
-
69
-
70
-
71
-
72
-
73
-
74
-
75
-
76
-
77
-
78
-
79
-
80
-
81
-
82
-
83
-
84
-
85
-
86
-
87
-
88
-
89
-
90
-
91
-
92
-
93
-
94
-
95
-
96
 |
 |

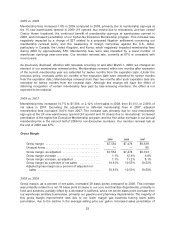
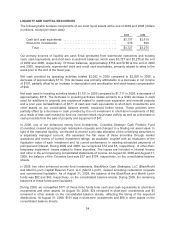
LIQUIDITY AND CAPITAL RESOURCES
The following table itemizes components of our most liquid assets at the end of 2009 and 2008 (dollars
in millions, except per share data):
2009 2008
Cash and cash equivalents .................................. $3,157 $2,619
Short-term investments ...................................... 570 656
Total ................................................. $3,727 $3,275
Our primary sources of liquidity are cash flows generated from warehouse operations and existing
cash, cash equivalents, and short-term investment balances, which were $3,727 and $3,275 at the end
of 2009 and 2008, respectively. Of these balances, approximately $758 and $788 at the end of 2009
and 2008, respectively, represented debit and credit card receivables, primarily related to sales in the
week prior to the end of the fiscal year.
Net cash provided by operating activities totaled $2,092 in 2009 compared to $2,206 in 2008, a
decrease of approximately $114. This decrease was primarily attributable to a decrease in net income
of $197, partially offset by an increase in depreciation and amortization and stock-based compensation
of $90.
Net cash used in investing activities totaled $1,101 in 2009 compared to $1,717 in 2008, a decrease of
approximately $616. The decrease in investing activities relates primarily to a $349 decrease in cash
used for additions to property and equipment related to warehouse expansion and remodel projects
and a prior year reclassification of $371 of cash and cash equivalents to short-term investments and
other assets on our consolidated balance sheets, explained further below. These activities were
partially offset by a decrease in cash provided by the net investment in short-term investments of $62
as a result of less cash needed to fund our common stock repurchase activity as well as a decrease in
cash proceeds from the sale of property and equipment of $41.
In 2008, one of our enhanced money fund investments, Columbia Strategic Cash Portfolio Fund
(Columbia), ceased accepting cash redemption requests and changed to a floating net asset value. In
light of the restricted liquidity, we elected to receive a pro-rata allocation of the underlying securities in
a separately managed account. We assessed the fair value of these securities through market
quotations and review of current investment ratings, as available, coupled with an evaluation of the
liquidation value of each investment and its current performance in meeting scheduled payments of
principal and interest. During 2009 and 2008, we recognized $12 and $5, respectively, of other-than-
temporary impairment losses related to these securities. The losses are included in interest income
and other in the accompanying consolidated statements of income. At August 30, 2009 and August 31,
2008, the balance of the Columbia fund was $27 and $104, respectively, on the consolidated balance
sheets.
In 2008, two other enhanced money fund investments, BlackRock Cash Strategies, LLC (BlackRock)
and Merrill Lynch Capital Reserve Fund, LLC (Merrill Lynch), ceased accepting redemption requests
and commenced liquidation. As of August 31, 2008, the balance of the BlackRock and Merrill Lynch
funds was $82 and $43, respectively, on the consolidated balance sheets. During 2009, the remaining
balances of these funds were liquidated.
During 2008, we reclassified $371 of these three funds from cash and cash equivalents to short-term
investments and other assets. At August 30, 2009, $24 remained in short-term investments and $3
remained in other assets on the consolidated balance sheets, reflecting the timing of the expected
distributions. At August 31, 2008, $161 was in short-term investments and $68 in other assets on the
consolidated balance sheets.
34