Costco 2009 Annual Report Download - page 77
Download and view the complete annual report
Please find page 77 of the 2009 Costco annual report below. You can navigate through the pages in the report by either clicking on the pages listed below, or by using the keyword search tool below to find specific information within the annual report.-
 1
1 -
2
-
3
-
4
-
5
-
6
-
7
-
8
-
9
-
10
-
11
-
12
-
13
-
14
-
15
-
16
-
17
-
18
-
19
-
20
-
21
-
22
-
23
-
24
-
25
-
26
-
27
-
28
-
29
-
30
-
31
-
32
-
33
-
34
-
35
-
36
-
37
-
38
-
39
-
40
-
41
-
42
-
43
-
44
-
45
-
46
-
47
-
48
-
49
-
50
-
51
-
52
-
53
-
54
-
55
-
56
-
57
-
58
-
59
-
60
-
61
-
62
-
63
-
64
-
65
-
66
-
 67
67 -
 68
68 -
 69
69 -
 70
70 -
 71
71 -
 72
72 -
 73
73 -
 74
74 -
 75
75 -
 76
76 -
 77
77 -
 78
78 -
 79
79 -
 80
80 -
 81
81 -
 82
82 -
 83
83 -
 84
84 -
 85
85 -
 86
86 -
 87
87 -
88
-
89
-
90
-
91
-
92
-
93
-
94
-
95
-
96
 |
 |

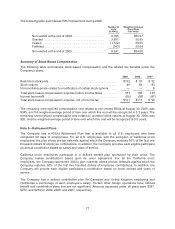
Summary of Stock Option Activity
The following table summarizes stock option transactions during 2009:
Shares
(in 000’s)
Weighted-
Average
Exercise
Price
Weighted-
Average
Remaining
Contractual
Term
(in Years)
Aggregate
Intrinsic
Value(1)
Outstanding at the end of 2008 ........ 21,394 $40.04
Granted ........................ — —
Exercised ...................... (2,539) 39.05
Forfeited or expired .............. (113) 40.77
Outstanding at the end of 2009(2) ...... 18,742 $40.17 3.95 $218
Exercisable at the end of 2009 ......... 16,588 $39.62 3.73 $202
(1) The difference between the original exercise price and market value of common stock at
August 30, 2009.
(2) Stock options generally vest over five years and have a ten-year term.
The following is a summary of stock options outstanding at the end of 2009 (number of options in
thousands):
Options Outstanding Options Exercisable
Range of Prices Number
Weighted
Average
Remaining
Contractual
Life
Weighted
Average
Exercise
Price Number
Weighted-
Average
Exercise
Price
$30.41–$37.35 ........... 7,498 3.60 $35.16 7,498 $35.16
$37.44–$43.00 ........... 3,377 1.96 40.45 3,377 40.45
$43.79–$43.79 ........... 5,953 5.59 43.79 4,295 43.79
$45.99–$52.50 ........... 1,914 3.72 48.01 1,418 48.63
18,742 3.95 $40.17 16,588 $39.62
At the end of 2008 and 2007, there were 15,735 and 19,283 options exercisable at weighted average
exercise prices of $39.14 and $38.35, respectively.
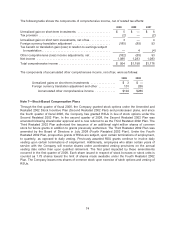
The tax benefits realized and intrinsic value related to total stock options exercised during 2009, 2008
and 2007 are provided in the following table:
2009 2008 2007
Actual tax benefit realized for stock options exercised ........ $10 $ 86 $ 66
Intrinsic value of stock options exercised(1) ................ $27 $262 $213
(1) The difference between the original exercise price and market value of common stock measured
at each individual exercise date.
75