Capital One 1998 Annual Report Download - page 56
Download and view the complete annual report
Please find page 56 of the 1998 Capital One annual report below. You can navigate through the pages in the report by either clicking on the pages listed below, or by using the keyword search tool below to find specific information within the annual report.-
 1
1 -
2
-
3
-
4
-
5
-
6
-
7
-
8
-
9
-
10
-
11
-
12
-
13
-
14
-
15
-
16
-
17
-
18
-
19
-
20
-
21
-
22
-
23
-
24
-
25
-
26
-
27
-
28
-
29
-
30
-
31
-
32
-
33
-
34
-
35
-
36
-
37
-
38
-
39
-
40
-
41
-
42
-
43
-
44
-
45
-
 46
46 -
 47
47 -
 48
48 -
 49
49 -
 50
50 -
 51
51 -
 52
52 -
 53
53 -
 54
54 -
 55
55 -
 56
56 -
 57
57 -
 58
58 -
 59
59 -
 60
60
 |
 |

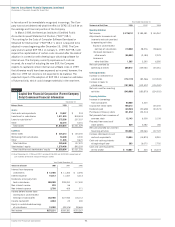
54Capital One Financial Corporation
Notes to Consolidated Financial Statements (continued)
(Currencies in Thousands, Except Per Share Data)
Year Ended December 31
Statements of Cash Flows 1998 1997 1996
Operating Activities:
Net income $ 275,231 $ 189,381 $(155,267
Adjustments to reconcile net
income to net cash provided
by operating activities:
Equity in undistributed
earnings of subsidiaries (19,902) 38,576 (38,665)
(Increase) decrease in
other assets (56,682) (2,183) 2,079
Increase in
other liabilities 1,365 3,290 6,380
Net cash provided by
operating activities 200,012 229,064 125,061
Investing Activities:
Increase in investment in
subsidiaries (172,119) (83,366) (119,502)
Increase in loans to
subsidiaries (167,889) (102,507) (105,000)
Net cash used for investing
activities (340,008) (185,873) (224,502)
Financing Activities:
Increase in borrowings
from subsidiaries 50,900 3,300
Issuance of senior notes 199,213 125,000
Dividends paid (20,533) (20,638) (20,573)
Purchases of treasury stock (91,672) (52,314)
Net proceeds from issuances of
common stock 12,143 6,509 3,109
Proceeds from exercise of
stock options 629 4,082 186
Net cash provided by (used for)
financing activities 150,680 (59,061) 107,722
Increase (decrease) in cash
and cash equivalents 10,684 (15,870) 8,281
Cash and cash equivalents
at beginning of year 203 16,073 7,792
Cash and cash equivalents
at end of year $ 10,887 $ 203 $(16,073
in fair value will be immediately recognized in earnings. The Com-
pany has not yet determined what the effect of SFAS 133 will be on
the earnings and financial position of the Company.
In March 1998, the American Institute of Certified Public
Accountants issued Statement of Position (“SOP”) 98-1,
“Accounting for the Costs of Computer Software Developed or
Obtained for Internal Use” (“SOP 98-1”), which is required to be
adopted in years beginning after December 15, 1998. The Com-
pany plans to adopt SOP 98-1 on January 1, 1999. SOP 98-1 will
require the capitalization of certain costs incurred after the date of
adoption in connection with developing or obtaining software for
internal use. The Company currently expenses such costs as
incurred. As a result of adopting the new SOP, the Company
expects to capitalize certain internal use software costs in 1999
that otherwise would have been expensed as incurred; however, the
effect on 1999 net income is not expected to be material. The
expected impact of the adoption of SOP 98-1 is based on estimates
of future activity, which could change materially in the near term.
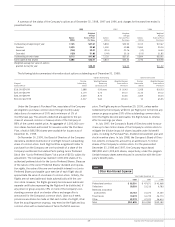
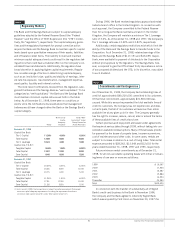
Note S
Capital One Financial Corporation (Parent Company
Only) Condensed Financial Information
December 31
Balance Sheets 1998 1997
Assets:
Cash and cash equivalents $ 10,887 $ 203
Investment in subsidiaries 1,211,255 818,518
Loans to subsidiaries(1) 375,396 207,507
Other 62,316 5,001
Total assets $1,659,854 $1,031,229
Liabilities:
Senior notes $ 324,213 $ 125,000
Borrowings from subsidiaries 54,200 3,300
Other 11,035 9,670
Total liabilities 389,448 137,970
Stockholders’ equity 1,270,406 893,259
Total liabilities and stockholders’ equity $1,659,854 $1,031,229
(1) As of December 31, 1998 and 1997, includes $108,400 and $143,500, respectively, of
cash invested at the Bank instead of the open market.
Year Ended December 31
Statements of Income 1998 1997 1996
Interest from temporary
investments $ 12,485 $ 11,352 $ 2,296
Interest expense 18,212 11,067 3,013
Dividends, principally from
bank subsidiaries 260,000 228,000 117,400
Non-interest income 893 56
Non-interest expense 2,700 409 571
Income before income taxes
and equity in undistributed
earnings of subsidiaries 252,466 227,932 116,112
Income tax benefit 2,863 25 490
Equity in undistributed earnings
of subsidiaries 19,902 (38,576) 38,665
Net income $275,231 $189,381 $155,267