Capital One 1998 Annual Report Download - page 33
Download and view the complete annual report
Please find page 33 of the 1998 Capital One annual report below. You can navigate through the pages in the report by either clicking on the pages listed below, or by using the keyword search tool below to find specific information within the annual report.-
 1
1 -
2
-
3
-
4
-
5
-
6
-
7
-
8
-
9
-
10
-
11
-
12
-
13
-
14
-
15
-
16
-
17
-
18
-
19
-
20
-
21
-
22
-
 23
23 -
 24
24 -
 25
25 -
 26
26 -
 27
27 -
 28
28 -
 29
29 -
 30
30 -
 31
31 -
 32
32 -
 33
33 -
 34
34 -
 35
35 -
 36
36 -
 37
37 -
 38
38 -
 39
39 -
 40
40 -
 41
41 -
 42
42 -
 43
43 -
44
-
45
-
46
-
47
-
48
-
49
-
50
-
51
-
52
-
53
-
54
-
55
-
56
-
57
-
58
-
59
-
60
 |
 |

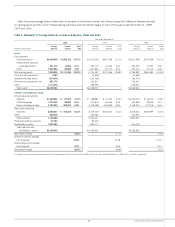
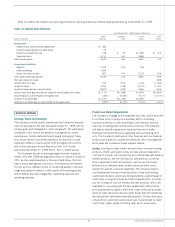
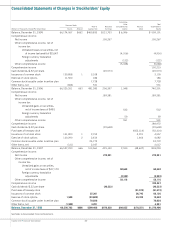
Table 12: Interest Rate Sensitivity
As of December 31, 1998, Subject to Repricing
Within >180 Days- >1 Year- Over
(Dollars in Millions) 180 Days 1 Year 5 Years 5 Years
Earning assets:
Federal funds sold and resale agreements $(262
Interest-bearing deposits at other banks 22
Securities available for sale 148 $ (95 $(1,082 $ (472
Consumer loans 3,111 161 2,885
Total earning assets 3,543 256 3,967 472
Interest-bearing liabilities:
Deposits 1,019 243 738
Other borrowings 1,644
Senior and deposit notes 467 470 2,123 679
Total interest-bearing liabilities 3,130 713 2,861 679
Non-rate related net assets (855)
Interest sensitivity gap 413 (457) 1,106 (1,062)
Impact of swaps 3,264 (138) (2,119) (1,007)
Impact of consumer loan securitizations (3,847) (493) 4,966 (626)
Interest sensitivity gap adjusted for impact of securitizations and swaps $ (170) $(1,088) $(3,953 $(2,695)
Adjusted gap as a percentage of managed assets (.82)% (5.28)% 19.17% (13.07)%
Adjusted cumulative gap $ (170) $(1,258) $(2,695
Adjusted cumulative gap as a percentage of managed assets (.82)% (6.10)% 13.07% 0.00)%
31 Capital One Financial Corporation
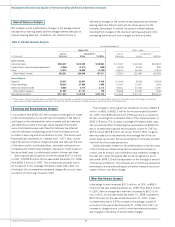
Product and Market Opportunities
The Company’s strategy for future growth has been, and is expected
to continue to be, to apply its proprietary IBS to its lending
business as well as to other businesses, both financial and non-
financial, including telecommunications services. The Company
will seek to identify new product opportunities and to make
informed investment decisions regarding new and existing prod-
ucts. The Company’s lending and other financial and non-financial
products are subject to competitive pressures, which management
anticipates will increase as these markets mature.
Lending Lending includes credit card and other consumer lending
products. Credit card opportunities include, and are expected to
continue to include, low introductory and intermediate rate balance
transfer products, low non-introductory rate products, as well as
other customized credit card products, such as secured cards,
affinity and co-branded cards, student cards and other cards
tailored for specific consumer segments. The Company expects
continued growth across a broad spectrum of new and existing
customized products, which are distinguished by a varied range of
credit lines, pricing structures and other characteristics. For exam-
ple, the Company’s low non-introductory rate products, which are
marketed to consumers with the best established credit profiles,
are characterized by higher credit lines, lower yields and an expec-
tation of lower delinquencies and credit losses than the traditional
low introductory rate balance transfer products. On the other hand,
certain other customized card products are characterized by lower
credit lines, higher yields (including fees) and in some cases,
Business Outlook
Earnings, Goals and Strategies
This business outlook section summarizes the Company’s expecta-
tions for earnings for the year ending December 31, 1999, and its
primary goals and strategies for continued growth. The statements
contained in this section are based on management’s current
expectations. Certain statements are forward looking and, there-
fore, actual results could differ materially. Factors which could
materially influence results are set forth throughout this section
and in the Company’s Annual Report on Form 10-K for the
year ended December 31, 1998 (Part I, Item 1, Risk Factors).
The Company has set an earnings target increase of approxi-
mately 30% over 1998 earnings and a return on equity in excess of
20%. As discussed elsewhere in this report and below, the Com-
pany’s actual earnings are a function of its revenues (net interest
income and non-interest income on its earning assets), consumer
usage and payment patterns, credit quality of its earning assets
(which affects fees and charge-offs), marketing expenses and
operating expenses.
Table 12 reflects the interest rate repricing schedule for earning assets and interest-bearing liabilities as of December 31, 1998.