Capital One 1998 Annual Report Download - page 19
Download and view the complete annual report
Please find page 19 of the 1998 Capital One annual report below. You can navigate through the pages in the report by either clicking on the pages listed below, or by using the keyword search tool below to find specific information within the annual report.-
 1
1 -
2
-
3
-
4
-
5
-
6
-
7
-
8
-
 9
9 -
 10
10 -
 11
11 -
 12
12 -
 13
13 -
 14
14 -
 15
15 -
 16
16 -
 17
17 -
 18
18 -
 19
19 -
 20
20 -
 21
21 -
 22
22 -
 23
23 -
 24
24 -
 25
25 -
 26
26 -
 27
27 -
 28
28 -
 29
29 -
30
-
31
-
32
-
33
-
34
-
35
-
36
-
37
-
38
-
39
-
40
-
41
-
42
-
43
-
44
-
45
-
46
-
47
-
48
-
49
-
50
-
51
-
52
-
53
-
54
-
55
-
56
-
57
-
58
-
59
-
60
 |
 |

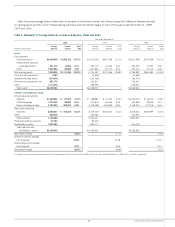
Year Ended December 31
Five-Year
Compound
(Dollars In Thousands, Except Per Share Data) 1998 1997 1996 1995 1994(1) Growth Rate
Income Statement Data:
Interest income $ 1,111,536 $ 717,985 $ 660,483 $ 457,409 $ 258,672 33.73%
Interest expense 416,754 334,847 294,999 249,396 93,695 43.71
Net interest income 694,782 383,138 365,484 208,013 164,977 29.35
Provision for loan losses 267,028 262,837 167,246 65,895 30,727 50.99
Net interest income after
provision for loan losses 427,754 120,301 198,238 142,118 134,250 22.07
Non-interest income 1,488,283 1,069,130 763,424 553,043 396,902 50.18
Non-interest expense 1,472,116 883,978 713,182 497,430 384,325 51.94
Income before income taxes 443,921 305,453 248,480 197,731 146,827 21.04
Income taxes 168,690 116,072 93,213 71,220 51,564 22.82
Net income $ 275,231 $ 189,381 $ 155,267 $ 126,511 $ 95,263 20.03%
Dividend payout ratio 7.46% 10.90% 13.24% 12.55%
Per Common Share:
Basic earnings(2) $ 4.20 $ 2.87 $ 2.34 $ 1.93 $ 1.44 20.26%
Diluted earnings(2) 3.96 2.80 2.32 1.91 1.44 18.85
Dividends .32 .32 .32 .24
Book value as of year-end 19.35 13.66 11.16 9.05 7.18
Average common shares 65,589,643 66,069,897 66,227,631 65,690,838 66,067,250
Average common and common
equivalent shares 69,588,432 67,650,864 67,025,233 66,392,284 66,067,250
Selected Average Balances:
Securities $ 1,877,276 $ 1,650,961 $ 1,147,079 $ 962,624 $ 62,626
Allowance for loan losses (214,333) (132,728) (83,573) (69,939) (66,434) 29.11%
Total assets 8,330,432 6,568,937 5,568,960 4,436,055 2,629,920 29.48
Deposits 1,430,042 958,885 1,046,122 769,688 36,248
Other borrowings 5,163,795 4,350,864 3,623,104 2,952,162 2,287,474 19.17
Preferred beneficial interests 97,793 89,529
Stockholders’/Division equity(3) 1,087,983 824,077 676,759 543,364 239,616 57.07
Selected Year-End Balances:
Securities $ 2,080,980 $ 1,475,354 $ 1,358,103 $ 1,244,195 $ 425,570
Consumer loans 6,157,111 4,861,687 4,343,902 2,921,679 2,228,455
Allowance for loan losses (231,000) (183,000) (118,500) (72,000) (68,516)
Total assets 9,419,403 7,078,279 6,467,445 4,759,321 3,091,980
Deposits 1,999,979 1,313,654 943,022 696,037 452,201
Borrowings 5,383,672 4,428,886 4,525,216 3,301,672 2,062,688
Preferred beneficial interests 97,921 97,664
Stockholders’/Division equity(3) 1,270,406 893,259 740,391 599,191 474,557
Managed Consumer Loan Data:
Average reported loans $ 5,348,559 $ 4,103,036 $ 3,651,908 $ 2,940,208 $ 2,286,684 19.30%
Average off-balance sheet loans 9,860,978 8,904,146 7,616,553 6,149,070 3,910,739 56.45
Average total managed loans 15,209,537 13,007,182 11,268,461 9,089,278 6,197,423 36.03
Interest income 2,583,872 2,045,967 1,662,990 1,192,100 733,659 42.97
Year-end total managed loans 17,395,126 14,231,015 12,803,969 10,445,480 7,378,455 29.20
Year-end total accounts (000’s) 16,706 11,747 8,586 6,149 5,049 39.89
Yield 16.99% 15.73% 14.76% 13.12% 11.84%
Net interest margin 9.95 8.86 8.16 6.27 6.90
Delinquency rate 4.70 6.20 6.24 4.20 2.95
Net charge-off rate 5.33 6.59 4.24 2.25 1.48
Operating Ratios:
Return on average assets 3.30% 2.88% 2.79% 2.85% 3.62%
Return on average equity 25.30 22.98 22.94 23.28 39.76
Equity to assets (average) 13.06 12.55 12.15 12.25 9.11
Allowance for loan losses to loans
as of year-end 3.75 3.76 2.73 2.86 3.07
(1) The Company’s results prior to November 22, 1994, reflect operations as a division of Signet Bank. Prior to November 22, 1994, Signet Banking Corporation, the parent of
Signet Bank, had provided significant financial and operational support to the Company.
(2) Assumes 66,067,250 shares outstanding prior to November 22, 1994.
(3) Division equity reflects an allocation of capital to Capital One Bank as a division for purposes of preparation of the financial statements of the Company. Such allocation
is not subject to regulatory minimums.
17 Capital One Financial Corporation
Selected Financial and Operating Data