Capital One 1998 Annual Report Download - page 26
Download and view the complete annual report
Please find page 26 of the 1998 Capital One annual report below. You can navigate through the pages in the report by either clicking on the pages listed below, or by using the keyword search tool below to find specific information within the annual report.-
 1
1 -
2
-
3
-
4
-
5
-
6
-
7
-
8
-
9
-
10
-
11
-
12
-
13
-
14
-
15
-
 16
16 -
 17
17 -
 18
18 -
 19
19 -
 20
20 -
 21
21 -
 22
22 -
 23
23 -
 24
24 -
 25
25 -
 26
26 -
 27
27 -
 28
28 -
 29
29 -
 30
30 -
 31
31 -
 32
32 -
 33
33 -
 34
34 -
 35
35 -
 36
36 -
37
-
38
-
39
-
40
-
41
-
42
-
43
-
44
-
45
-
46
-
47
-
48
-
49
-
50
-
51
-
52
-
53
-
54
-
55
-
56
-
57
-
58
-
59
-
60
 |
 |

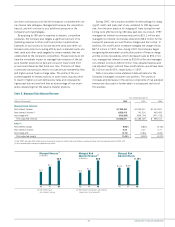
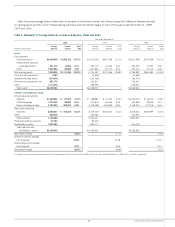
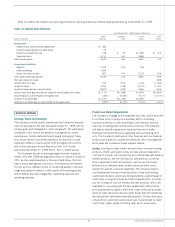
Table 5: Interest Variance Analysis
Year Ended December 31
1998 vs. 1997 1997 VS. 1996
Increase Change Due to(1) Increase Change Due to(1)
(In Thousands) (Decrease) Volume Yield/Rate (Decrease) Volume Yield/Rate
Interest Income:
Consumer loans $383,337 $213,453 $169,884 $(27,697 $ 69,924 $(42,227)
Federal funds sold and resale agreements (3,859) (3,371) (488) (4,870) (5,676) 806
Other 14,073 16,856 (2,783) 34,675 36,545 (1,870)
Total interest income 393,551 206,040 187,511 57,502 123,085 (65,583)
Interest Expense:
Deposits 25,547 22,007 3,540 (14,340) (4,422) (9,918)
Other borrowings 49,534 47,854 1,680 10,557 10,947 (390)
Senior and deposit notes 6,826 4,713 2,113 43,631 37,446 6,185
Total interest expense 81,907 81,157 750 39,848 40,394 (546)
Net interest income(1) $311,644 $113,910 $197,734 $(17,654 $ 67,129 $(49,475)
(1) The change in interest due to both volume and yield/rates has been allocated in proportion to the relationship of the absolute dollar amounts of the change in each. The changes in income and
expense are calculated independently for each line in the table. The totals for the volume and yield/rate columns are not the sum of the individual lines.
24Capital One Financial Corporation
Management’s Discussion and Analysis of Financial Condition and Results of Operations (continued)
The increase in servicing and securitizations income of $222.5
million, or 48%, to $682.3 million for the year ended December
31, 1997, from $459.8 million for 1996 was due to a number of
factors, including the incremental effect of the implementation of
SFAS 125 and a 17% increase in average off-balance sheet loans.
The incremental effect of adopting the requirements of SFAS 125
was to increase servicing and securitizations income in 1997 by
$32.0 million ($19.8 million net of tax). Prior to 1997, no gains
were recorded due to the relatively short average life of the con-
sumer loans securitized. Excess servicing fee income was recorded
over the life of each sale transaction.
Certain estimates inherent in the determination of the fair value
of the I/O strip are influenced by factors outside the Company’s
control, and as a result, such estimates could materially change in
the near term. Any future gains that will be recognized in accor-
dance with SFAS 125 will be dependent on the timing and amount
of future securitizations. The Company will continuously assess the
performance of new and existing securitization transactions as esti-
mates of future cash flows change.
Other Non-Interest Income
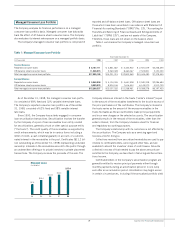
Interchange income increased $37.5 million, or 76%, to $86.5
million for the year ended December 31, 1998, from $49.0 million
in 1997. Service charges and other fees increased to $612.0 mil-
lion, or 81%, for the year ended December 31, 1998 compared to
$337.8 million for the year ended December 31, 1997. These
increases were due to a 39% increase in the average number of
accounts for the year ended December 31, 1998, from 1997, an
increase in charge volume, a shift to more fee-intensive products
and changes in the terms of overlimit fees charged.
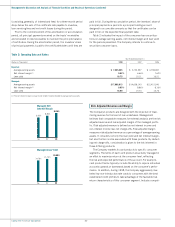
Servicing and Securitizations Income
In accordance with SFAS 125, the Company records gains or losses
on the securitizations of consumer loan receivables on the date of
sale based on the estimated fair value of assets sold and retained
and liabilities incurred in the sale. Gains represent the present
value of estimated excess cash flows the Company has retained
over the estimated outstanding period of the receivables and are
included in servicing and securitizations income. This excess cash
flow essentially represents an “interest only” (“I/O”) strip, consist-
ing of the excess of finance charges and past-due fees over the sum
of the return paid to certificateholders, estimated contractual ser-
vicing fees and credit losses. However, exposure to credit losses on
the securitized loans is contractually limited to these cash flows.
Servicing and securitizations income increased $107.5 million,
or 16%, to $789.8 million for the year ended December 31, 1998,
from $682.3 million in 1997. This increase was primarily due to
an increase of 11% in average off-balance sheet loans. Also con-
tributing to this increase were decreased charge-offs on such loans
as a result of improving consumer credit.
affected by changes in the volume of earning assets and interest-
bearing liabilities. Table 5 sets forth the dollar amount of the
increases (decreases) in interest income and interest expense
resulting from changes in the volume of earning assets and inter-
est-bearing liabilities and from changes in yields and rates.
Interest Variance Analysis
Net interest income is affected by changes in the average interest
rate earned on earning assets and the average interest rate paid on
interest-bearing liabilities. In addition, net interest income is