Capital One 1998 Annual Report Download - page 27
Download and view the complete annual report
Please find page 27 of the 1998 Capital One annual report below. You can navigate through the pages in the report by either clicking on the pages listed below, or by using the keyword search tool below to find specific information within the annual report.-
 1
1 -
2
-
3
-
4
-
5
-
6
-
7
-
8
-
9
-
10
-
11
-
12
-
13
-
14
-
15
-
16
-
 17
17 -
 18
18 -
 19
19 -
 20
20 -
 21
21 -
 22
22 -
 23
23 -
 24
24 -
 25
25 -
 26
26 -
 27
27 -
 28
28 -
 29
29 -
 30
30 -
 31
31 -
 32
32 -
 33
33 -
 34
34 -
 35
35 -
 36
36 -
 37
37 -
38
-
39
-
40
-
41
-
42
-
43
-
44
-
45
-
46
-
47
-
48
-
49
-
50
-
51
-
52
-
53
-
54
-
55
-
56
-
57
-
58
-
59
-
60
 |
 |
25 Capital One Financial Corporation
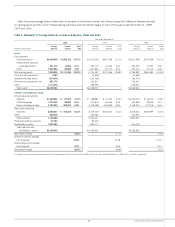
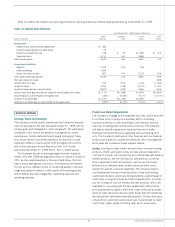
Non-interest expense for the year ended December 31, 1997
increased $170.8 million, or 24%, to $884.0 million from
$713.2 million for the year ended December 31, 1996. Contrib-
uting to the increase in non-interest expense was salaries and asso-
ciate benefits expense, which increased $74.1 million, or 34%, to
$289.3 million in 1997 compared to $215.2 million in 1996. This
increase reflected additional staff associated with the cost of opera-
tions to manage the growth in accounts and $17.0 million in addi-
tional expense associated with the Company’s associate stock
plans. Also contributing to the increase in non-interest expense was
marketing expenses which increased $18.2 million, or 9%, to
$224.8 million in 1997, from $206.6 million in 1996. All other
non-interest expenses increased $78.4 million, or 27%, to $369.8
million in 1997 compared to $291.4 million in 1996. The increase
in other non-interest expenses was primarily the result of a 33%
increase in the average number of accounts for the year ended
December 31, 1997.
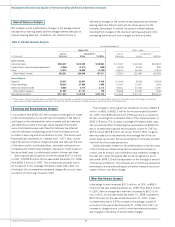
Income Taxes
The Company’s income tax rate was 38% for the years ended
December 31, 1998 and 1997, and 37.5% for the year ended
December 31, 1996. The effective rate includes both state and
federal income tax components.
Asset Quality
The asset quality of a portfolio is generally a function of the initial
underwriting criteria used, seasoning of the accounts, levels of
competition, account management activities and demographic con-
centration, as well as general economic conditions. Accounts tend
to exhibit a rising trend of delinquency and credit losses as they
season. As of December 31, 1998 and 1997, 59% and 53% of
managed accounts, representing 51% and 43% of the total man-
aged loan balance, respectively, were less than eighteen months
old. Accordingly, it is likely that the Company’s managed loan port-
folio could experience increased levels of delinquency and credit
losses as the average age of the Company’s accounts increases.
Changes in the rates of delinquency and credit losses can also
result from a shift in the product mix. As discussed in “Risk
Adjusted Revenue and Margin,” certain other customized card
products have, in some cases, higher delinquency and higher
charge-off rates. In the case of secured card loans, collateral, in the
form of cash deposits, reduces any ultimate charge-offs. The costs
associated with higher delinquency and charge-off rates are consid-
ered in the pricing of individual products.
During 1998, general economic conditions for consumer credit
stabilized and improved as industry levels of charge-offs (including
bankruptcies) and delinquencies both decreased. These trends
have positively impacted the Company’s 1998 results.
Interchange income decreased $2.4 million, or 5%, to $49.0 mil-
lion for the year ended December 31, 1997, from $51.4 million in
1996 as a result of the securitization of a higher percentage of more
fee-intensive other credit card products in 1997 compared to 1996.
Service charges and other fees increased to $337.8 million, or 34%,
for the year ended December 31, 1997 compared to $252.2 million
for the year ended December 31, 1996. This increase was due to a
33% increase in the average number of accounts for the year ended
December 31, 1997, from 1996, a shift to more fee-intensive prod-
ucts and changes in the terms of overlimit fees charged.
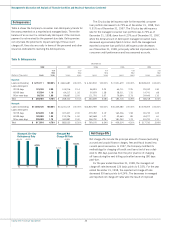
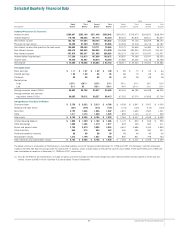
Non-Interest Expense
Non-interest expense for the year ended December 31, 1998,
increased $588.1 million, or 67%, to $1.5 billion from $884.0
million for the year ended December 31, 1997. Contributing to the
increase in non-interest expense were marketing expenses which
increased $221.4 million, or 98%, to $446.3 million in 1998,
from $224.8 million in 1997. The increase in marketing expenses
during 1998 reflects the Company’s continued identification of and
investments in opportunities for growth. Salaries and associate
benefits increased $187.1 million, or 65%, to $476.4 million in
1998, from $289.3 million in 1997, as the Company added 4,526
associates to manage the growth in the Company’s accounts. This
increase also reflects an additional $45.3 million in compensation
expense associated with the Company’s associate stock plans com-
pared to the prior year. All other non-interest expenses increased
$179.6 million, or 49%, to $549.5 million for the year ended
December 31, 1998, from $369.8 million in 1997. The increase
in other non-interest expense, as well as the increase in salaries
and associate benefits not attributable to the Company’s associate
stock plans, was primarily a result of a 39% increase in the average
number of accounts for the year ended December 31, 1998, which
resulted in an increase in staff and other operational costs associ-
ated with the Company’s growth pattern.
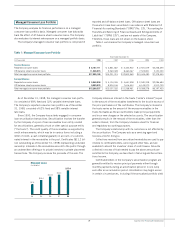
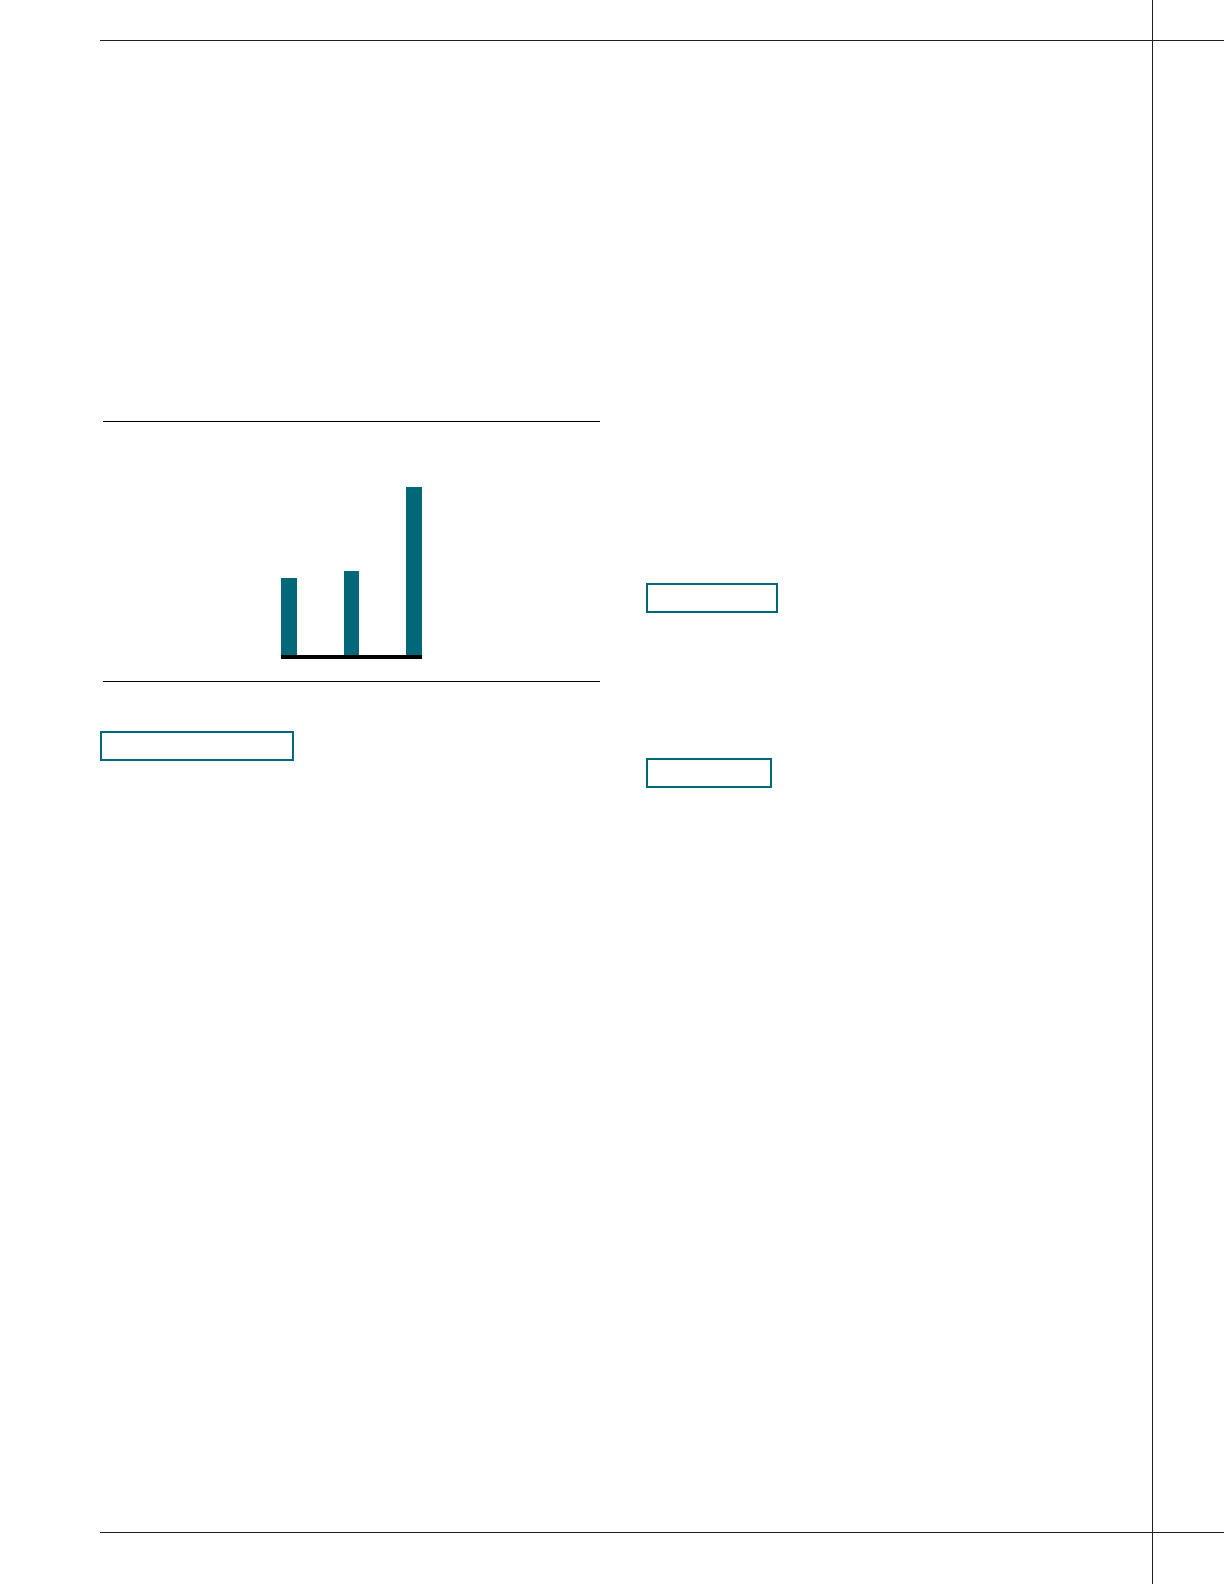
$446
$225
$207
Marketing Investment
(In Millions)
96 97 98