Capital One 1998 Annual Report Download - page 23
Download and view the complete annual report
Please find page 23 of the 1998 Capital One annual report below. You can navigate through the pages in the report by either clicking on the pages listed below, or by using the keyword search tool below to find specific information within the annual report.-
 1
1 -
2
-
3
-
4
-
5
-
6
-
7
-
8
-
9
-
10
-
11
-
12
-
 13
13 -
 14
14 -
 15
15 -
 16
16 -
 17
17 -
 18
18 -
 19
19 -
 20
20 -
 21
21 -
 22
22 -
 23
23 -
 24
24 -
 25
25 -
 26
26 -
 27
27 -
 28
28 -
 29
29 -
 30
30 -
 31
31 -
 32
32 -
 33
33 -
34
-
35
-
36
-
37
-
38
-
39
-
40
-
41
-
42
-
43
-
44
-
45
-
46
-
47
-
48
-
49
-
50
-
51
-
52
-
53
-
54
-
55
-
56
-
57
-
58
-
59
-
60
 |
 |
21 Capital One Financial Corporation
During 1997, the Company modified its methodology for charg-
ing off credit card loans (net of any collateral) to 180 days past-
due, from the prior practice of charging off loans during the next
billing cycle after becoming 180 days past-due. As a result, 1997
managed net interest income was reduced by $15.1 million and
managed non-interest income was reduced by $8.0 million for the
reversal of previously accrued finance charges and fee income. In
addition, this modification increased managed net charge-offs by
$47.4 million in 1997. Also, during 1997, the Company began
recognizing the estimated uncollectible portion of finance charge
and fee income receivables, which decreased loans by $50.2 mil-
lion, managed net interest income by $19.8 million and managed
non-interest income by $30.4 million. Risk adjusted revenue and
risk adjusted margin, without these modifications, would have been
$1.3 billion and 8.92%, respectively, in 1997.
Table 3 provides income statement data and ratios for the
Company’s managed consumer loan portfolio. The causes of
increases and decreases in the various components of risk adjusted
revenue are discussed in further detail in subsequent sections of
this analysis.
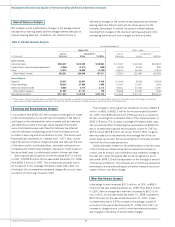
tors have continuously solicited the Company’s customers with sim-
ilar interest rate strategies. Management believes the competition
has put, and will continue to put, additional pressure on the
Company’s pricing strategies.
By applying its IBS and in response to dynamic competitive
pressures, the Company also targets a significant amount of its
marketing expense to other credit card product opportunities.
Examples of such products include secured cards and other cus-
tomized card products including affinity and co-branded cards, stu-
dent cards and other cards targeted to certain markets that are
underserved by the Company’s competitors. These products do not
have the immediate impact on managed loan balances of the bal-
ance transfer products but typically consist of lower credit limit
accounts and balances that build over time. The terms of these
customized card products tend to include annual membership fees
and higher annual finance charge rates. The profile of the con-
sumers targeted for these products, in some cases, may also tend
to result in higher account delinquency rates and consequently
higher past-due and overlimit fees as a percentage of loan receiv-
ables outstanding than the balance transfer products.
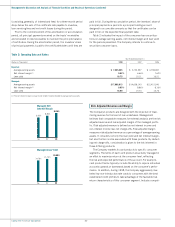
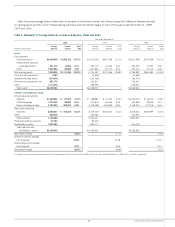
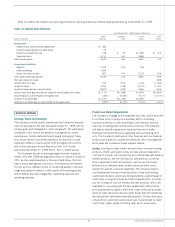
Table 3: Managed Risk Adjusted Revenue
Year Ended December 31
(Dollars in Thousands) 1998 1997 1996
Managed Income Statement:
Net interest income $1,700,424 $1,299,317 $1,013,557
Non-interest income(1) 1,066,413 743,516 460,492
Net charge-offs (810,306) (856,704) (477,732)
Risk adjusted revenue $1,956,531 $1,186,129 $ 996,317
Ratios(2):
Net interest margin 9.95% 8.86% 8.16%
Non-interest income 6.24 5.07 3.71
Net charge-offs (4.74) (5.84) (3.85)
Risk adjusted margin 11.45% 8.09% 8.02%
(1) For 1997, excludes $32 million pre-tax incremental impact on credit card securitizations income resulting from the implementation of SFAS 125.
(2) As a percentage of average managed earning assets.
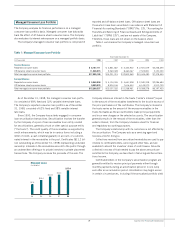
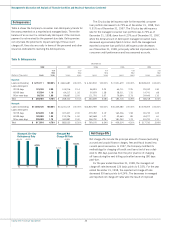
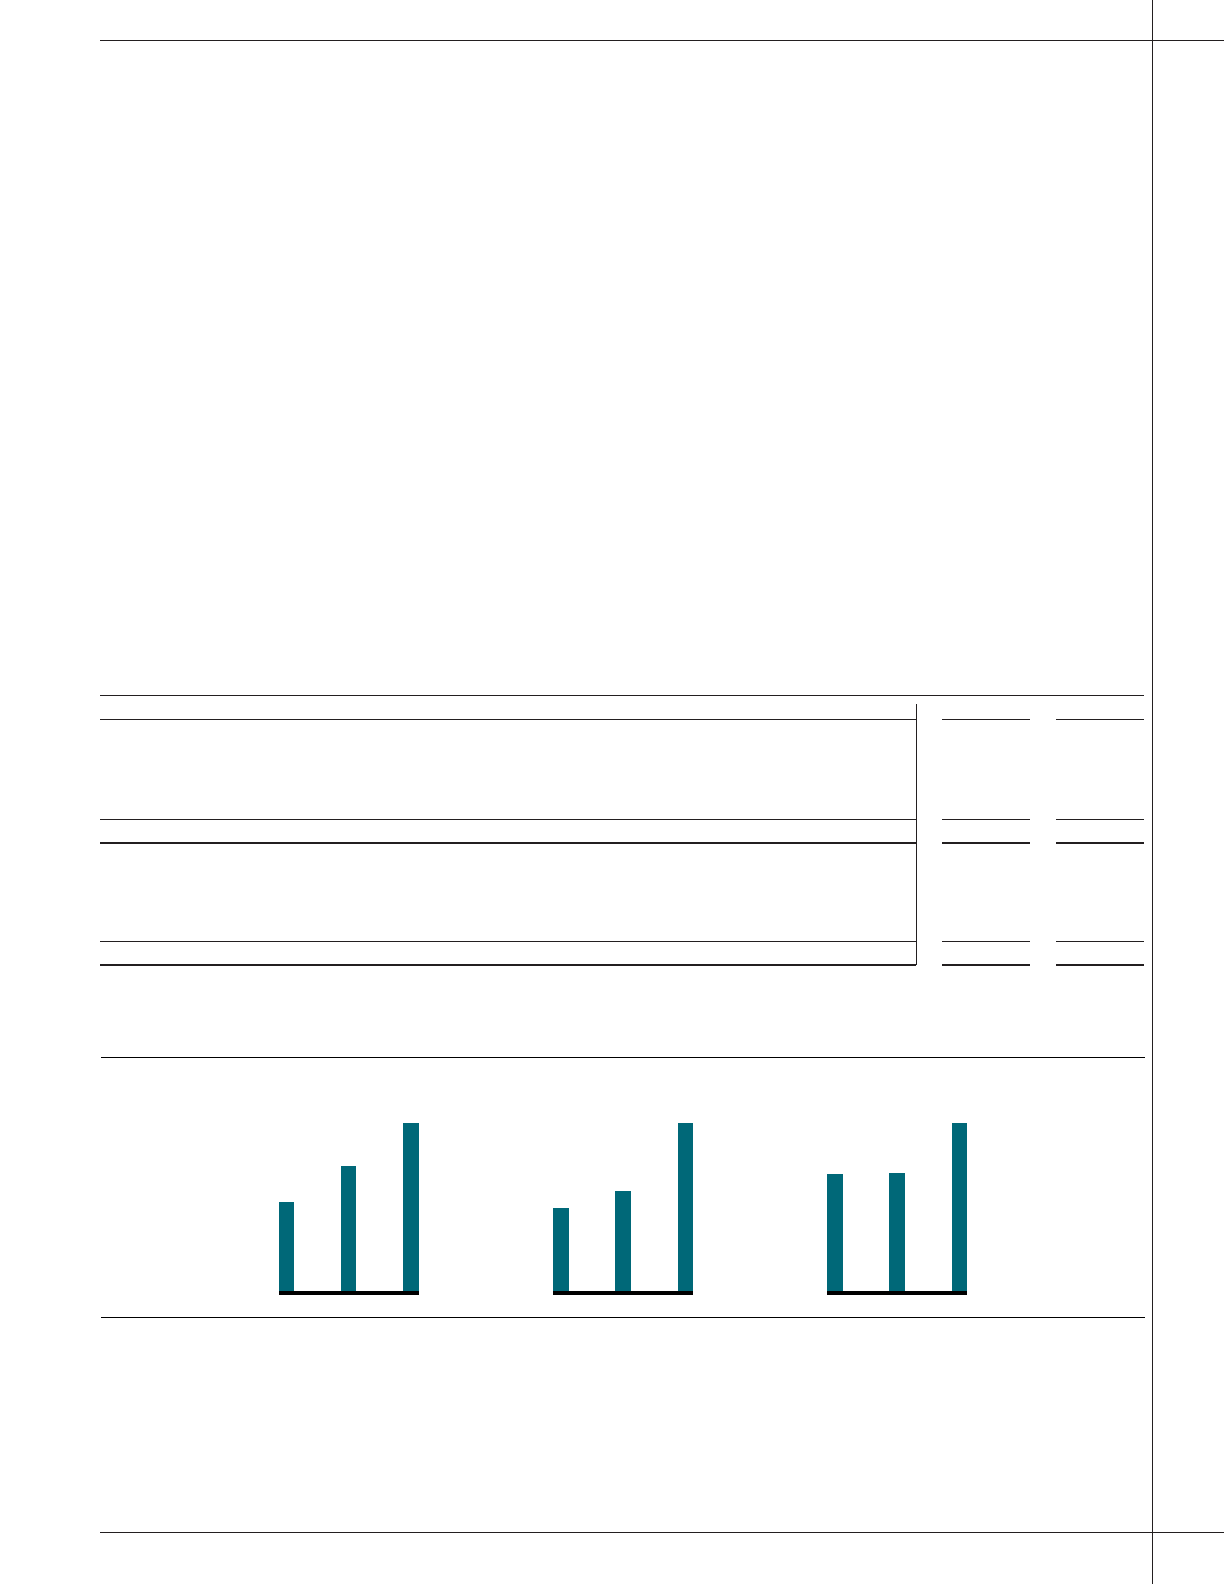
$2.8
$2.1
$1.5
Managed Revenue(1)
(In Billions)
96 97 98
$2.0
$1.2
$1.0
Managed Risk
Adjusted Revenue(2)
(In Billions)
96 97 98
(1) Net interest and
non-interest income.
(2) Net interest income plus non-interest
income less net charge-offs.
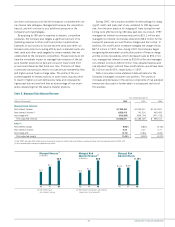
11.45%
8.09%
8.02%
Managed Risk
Adjusted Margin
96 97 98