Capital One 1998 Annual Report Download - page 3
Download and view the complete annual report
Please find page 3 of the 1998 Capital One annual report below. You can navigate through the pages in the report by either clicking on the pages listed below, or by using the keyword search tool below to find specific information within the annual report.-
 1
1 -
 2
2 -
 3
3 -
 4
4 -
 5
5 -
 6
6 -
 7
7 -
 8
8 -
 9
9 -
 10
10 -
 11
11 -
 12
12 -
 13
13 -
 14
14 -
15
-
16
-
17
-
18
-
19
-
20
-
21
-
22
-
23
-
24
-
25
-
26
-
27
-
28
-
29
-
30
-
31
-
32
-
33
-
34
-
35
-
36
-
37
-
38
-
39
-
40
-
41
-
42
-
43
-
44
-
45
-
46
-
47
-
48
-
49
-
50
-
51
-
52
-
53
-
54
-
55
-
56
-
57
-
58
-
59
-
60
 |
 |

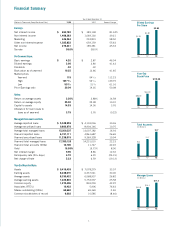
1
$3.96
$2.80
$2.32
Diluted Earnings
Per Share
96 97 98
$115.00
$54.19
$36.00
Year-End
Stock Price
96 97 98
16.7
11.7
8.6
Total Accounts
(In Millions)
96 97 98
$17.4
$14.2
$12.8
Managed Loans
(In Billions)
96 97 98
Financial Summary
Year Ended December 31
(Dollars in Thousands,Except Per Share Data) 1998 1997 Percent Change
Earnings:
Net interest income $ 694,782 $ 383,138 81.34%
Non-interest income 1,488,283 1,069,130 39.21
Marketing 446,264 224,819 98.50
Other non-interest expense 1,025,852 659,159 55.63
Net income 275,231 189,381 45.33
Tax rate 38.0% 38.0%
Per Common Share:
Basic earnings $ 4.20 $ 2.87 46.34
Diluted earnings 3.96 2.80 41.43
Dividends .32 .32
Book value as of year-end 19.35 13.66 41.65
Market prices
Year-end 115 54 3/16 112.23
High 129 15/16 54 3/16 139.79
Low 50 9/16 31 3/861.16
Price/Earnings ratio 29.04 19.35 50.08
Ratios:
Return on average assets 3.30% 2.88% 14.58
Return on average equity 25.30 22.98 10.10
Capital to assets 14.53 14.00 3.76
Allowance for loan losses to
loans as of year-end 3.75 3.76 (0.22)
Managed Consumer Loan Data:
Average reported loans $ 5,348,559 $ 4,103,036 30.36
Average securitized loans 9,860,978 8,904,146 10.75
Average total managed loans 15,209,537 13,007,182 16.93
Year-end reported loans 6,157,111 4,861,687 26.65
Year-end securitized loans 11,238,015 9,369,328 19.94
Year-end total managed loans 17,395,126 14,231,015 22.23
Year-end total accounts (000s) 16,706 11,747 42.22
Yield 16.99% 15.73% 8.00
Net interest margin 9.95 8.86 12.32
Delinquency rate (30+ days) 4.70 6.20 (24.19)
Net charge-off rate 5.33 6.59 (19.12)
Year-End Reported Data:
Assets $ 9,419,403 $ 7,078,279 33.07
Earning assets 8,238,091 6,337,041 30.00
Average assets 8,330,432 6,568,937 26.82
Average earning assets 7,225,835 5,753,997 25.58
Common equity 1,270,406 893,259 42.22
Associates (FTE’s) 10,432 5,906 76.63
Shares outstanding (000s) 65,660 65,369 0.44
Common stockholders of record 9,692 10,585 (8.44)