Capital One 1998 Annual Report Download - page 28
Download and view the complete annual report
Please find page 28 of the 1998 Capital One annual report below. You can navigate through the pages in the report by either clicking on the pages listed below, or by using the keyword search tool below to find specific information within the annual report.-
 1
1 -
2
-
3
-
4
-
5
-
6
-
7
-
8
-
9
-
10
-
11
-
12
-
13
-
14
-
15
-
16
-
17
-
 18
18 -
 19
19 -
 20
20 -
 21
21 -
 22
22 -
 23
23 -
 24
24 -
 25
25 -
 26
26 -
 27
27 -
 28
28 -
 29
29 -
 30
30 -
 31
31 -
 32
32 -
 33
33 -
 34
34 -
 35
35 -
 36
36 -
 37
37 -
 38
38 -
39
-
40
-
41
-
42
-
43
-
44
-
45
-
46
-
47
-
48
-
49
-
50
-
51
-
52
-
53
-
54
-
55
-
56
-
57
-
58
-
59
-
60
 |
 |
26Capital One Financial Corporation
Management’s Discussion and Analysis of Financial Condition and Results of Operations (continued)
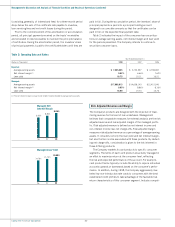
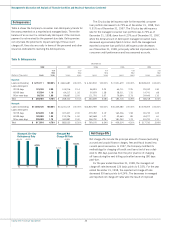
The 30-plus day delinquency rate for the reported consumer
loan portfolio decreased to 4.70% as of December 31, 1998, from
5.51% as of December 31, 1997. The 30-plus day delinquency
rate for the managed consumer loan portfolio was 4.70% as of
December 31, 1998, down from 6.20% as of December 31, 1997,
while the dollar amount of delinquent managed consumer loans
decreased approximately $64.2 million. Both the managed and
reported consumer loan portfolio’s delinquency rate decreases
as of December 31, 1998, principally reflected improvements in
consumer credit performance and less seasoned accounts.
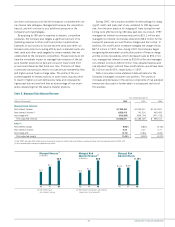
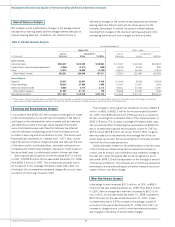
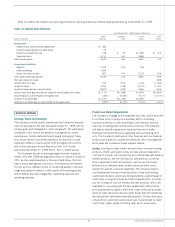
Net Charge-Offs
Net charge-offs include the principal amount of losses (excluding
accrued and unpaid finance charges, fees and fraud losses) less
current period recoveries. In 1997, the Company modified its
methodology for charging off credit card loans (net of any collat-
eral) to 180 days past-due from the prior practice of charging
off loans during the next billing cycle after becoming 180 days
past-due.
For the year ended December 31, 1998, the managed net
charge-off rate decreased 126 basis points to 5.33%. For the year
ended December 31, 1998, the reported net charge-off rate
decreased 59 basis points to 4.24%. The decreases in managed
and reported net charge-off rates were the result of improved
Delinquencies
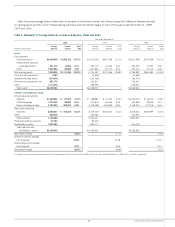
Table 6 shows the Company’s consumer loan delinquency trends for
the years presented on a reported and managed basis. The entire
balance of an account is contractually delinquent if the minimum
payment is not received by the payment due date. Delinquencies
not only have the potential to impact earnings if the account
charges off, they also are costly in terms of the personnel and other
resources dedicated to resolving the delinquencies.
Table 6: Delinquencies
December 31
1998 1997 1996 1995 1994
% of % of % of % of % of
Total Total Total Total Total
(Dollars in Thousands) Loans Loans Loans Loans Loans Loans Loans Loans Loans Loans
Reported:
Loans outstanding $ 6,157,111 100.00% $ 4,861,687 100.00% $ 4,343,902 100.00% $ 2,921,679 100.00% $2,228,455 100.00%
Loans delinquent:
30-59 days 123,162 2.00 104,216 2.14 96,819 2.23 65,711 2.25 29,032 1.30
60-89 days 67,504 1.10 64,217 1.32 55,679 1.28 38,311 1.31 14,741 .66
90 or more days 98,798 1.60 99,667 2.05 111,791 2.57 79,694 2.73 24,445 1.10
Total $ 289,464 4.70% $ 268,100 5.51% $ 264,289 6.08% $ 183,716 6.29% $ 68,218 3.06%
Managed:
Loans outstanding $17,395,126 100.00% $14,231,015 100.00% $12,803,969 100.00% $10,445,480 100.00% $7,378,455 100.00%
Loans delinquent:
30-59 days 329,239 1.89 327,407 2.30 279,787 2.19 165,306 1.58 90,733 1.23
60-89 days 182,982 1.05 213,726 1.50 162,668 1.27 92,665 .89 45,277 .61
90 or more days 305,589 1.76 340,887 2.40 356,700 2.78 181,243 1.73 81,720 1.11
Total $ 817,810 4.70% $ 882,020 6.20% $ 799,155 6.24% $ 439,214 4.20% $ 217,730 2.95%
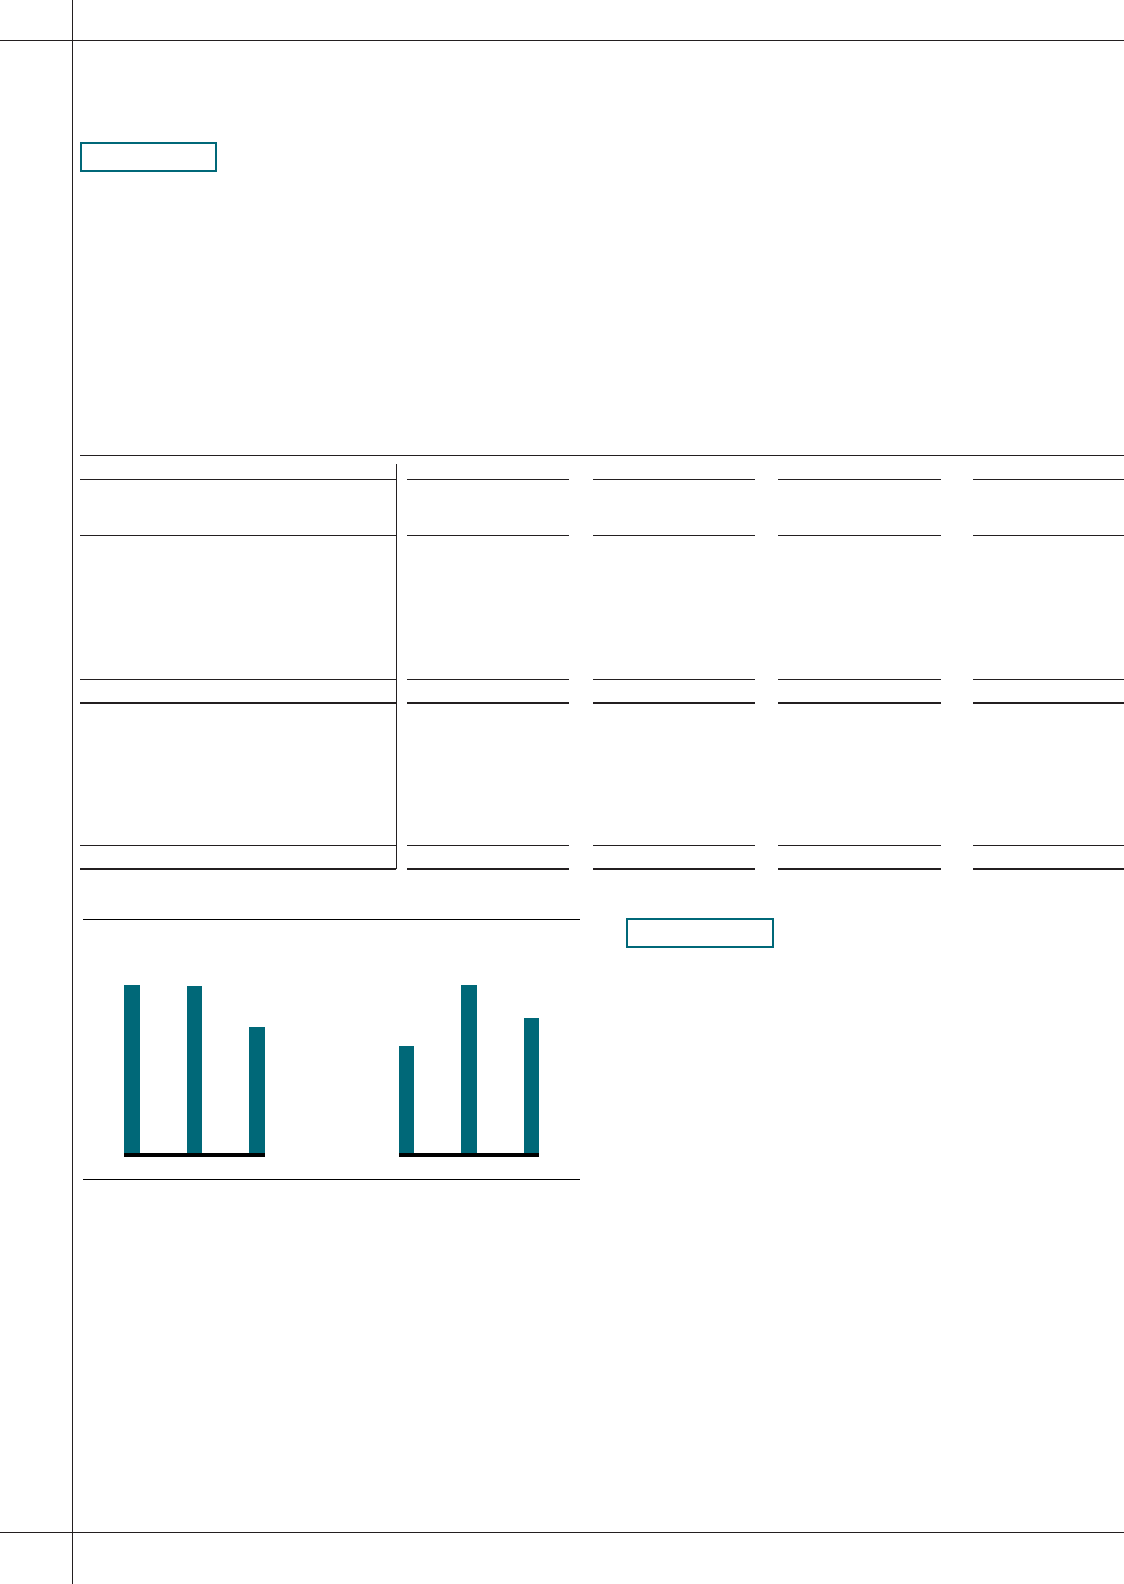
4.70%
6.20%
6.24%
Managed 30+ Day
Delinquency Rate
96 97 98
5.33%
6.59%
4.24%
Managed Net
Charge-Off Rate
96 97 98