Capital One 1998 Annual Report Download - page 37
Download and view the complete annual report
Please find page 37 of the 1998 Capital One annual report below. You can navigate through the pages in the report by either clicking on the pages listed below, or by using the keyword search tool below to find specific information within the annual report.-
 1
1 -
2
-
3
-
4
-
5
-
6
-
7
-
8
-
9
-
10
-
11
-
12
-
13
-
14
-
15
-
16
-
17
-
18
-
19
-
20
-
21
-
22
-
23
-
24
-
25
-
26
-
 27
27 -
 28
28 -
 29
29 -
 30
30 -
 31
31 -
 32
32 -
 33
33 -
 34
34 -
 35
35 -
 36
36 -
 37
37 -
 38
38 -
 39
39 -
 40
40 -
 41
41 -
 42
42 -
 43
43 -
 44
44 -
 45
45 -
 46
46 -
 47
47 -
48
-
49
-
50
-
51
-
52
-
53
-
54
-
55
-
56
-
57
-
58
-
59
-
60
 |
 |

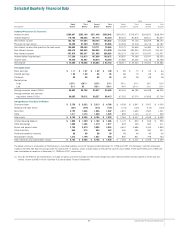
35 Capital One Financial Corporation
Selected Quarterly Financial Data
1998 1997
Fourth Third Second First Fourth Third Second First
(Unaudited) Quarter Quarter Quarter Quarter Quarter(1) Quarter Quarter Quarter
Summary Of Operations (In Thousands):
Interest income $298,947 $283,109 $271,438 $258,042 $203,551 $178,970 $166,870 $168,594
Interest expense 115,765 106,055 101,714 93,220 89,023 81,816 83,611 80,397
Net interest income 183,182 177,054 169,724 164,822 114,528 97,154 83,259 88,197
Provision for loan losses 54,580 67,569 59,013 85,866 94,356 72,518 46,776 49,187
Net interest income after provision for loan losses 128,602 109,485 110,771 78,956 20,172 24,636 36,483 39,010
Non-interest income 456,476 386,955 328,953 315,899 316,098 280,933 229,042 243,057
Non-interest expense 467,870 383,527 331,836 288,883 242,373 226,003 202,055 213,547
Income before income taxes 117,208 112,913 107,828 105,972 93,897 79,566 63,470 68,520
Income taxes 44,539 42,907 40,975 40,269 35,680 30,236 24,118 26,038
Net income $ 72,669 $ 70,006 $ 66,853 $ 65,703 $ 58,217 $ 49,330 $ 39,352 $ 42,482
Per Common Share:
Basic earnings $ 1.11 $ 1.07 $ 1.02 $ 1.00 $ .89 $ .75 $ .59 $ .64
Diluted earnings 1.04 1.00 .96 .96 .86 .73 .58 .63
Dividends .08 .08 .08 .08 .08 .08 .08 .08
Market prices
High 1257⁄16 12915⁄16 1253⁄8817⁄8543⁄16 453⁄4397⁄8435⁄8
Low 513⁄48315⁄16 825⁄16 509⁄16 441⁄83213⁄16 313⁄8331⁄4
Average common shares (000s) 65,663 65,726 65,537 65,428 65,535 66,185 66,428 66,336
Average common and common
equivalent shares (000s) 69,685 70,012 69,527 68,415 67,532 67,574 67,608 67,704
Average Balance Sheet Data: (In Millions)
Consumer loans $ 5,758 $ 5,623 $ 5,213 $ 4,786 $ 4,508 $ 3,847 $ 3,997 $ 4,059
Allowance for loan losses (231) (216) (213) (197) (174) (123) (119) (120)
Securities 2,155 1,626 1,826 1,922 1,831 1,690 1,563 1,521
Other 1,511 1,473 1,280 1,025 899 1,143 1,117 939
Total assets $ 9,193 $ 8,506 $ 8,106 $ 7,536 $ 7,064 $ 6,557 $ 6,558 $ 6,399
Interest-bearing deposits $ 1,886 $ 1,369 $ 1,193 $ 1,266 $ 1,172 $ 852 $ 818 $ 993
Other borrowings 1,606 1,496 1,319 1,077 823 595 695 411
Senior and deposit notes 3,742 3,819 3,906 3,683 3,614 3,686 3,769 3,809
Other liabilities 649 575 553 462 465 485 380 357
Preferred beneficial interests 98 98 98 98 98 98 98 65
Stockholders’ equity 1,212 1,149 1,037 950 892 841 798 764
Total liabilities and stockholders’ equity $ 9,193 $ 8,506 $ 8,106 $ 7,536 $ 7,064 $ 6,557 $ 6,558 $ 6,399
The above schedule is a tabulation of the Company’s unaudited quarterly results for the years ended December 31, 1998 and 1997. The Company’s common shares are
traded on the New York Stock Exchange under the symbol COF. In addition, shares may be traded in the over-the-counter stock market. There were 9,692 and 10,585 com-
mon stockholders of record as of December 31, 1998 and 1997, respectively.
(1) Includes the effect of the modifications in charge-off policy and finance charge and fee income recognition which reduced interest income by $24.4 million and non-
interest income by $48.9 million. See Note A to Consolidated Financial Statements.