Capital One 1998 Annual Report Download - page 43
Download and view the complete annual report
Please find page 43 of the 1998 Capital One annual report below. You can navigate through the pages in the report by either clicking on the pages listed below, or by using the keyword search tool below to find specific information within the annual report.-
 1
1 -
2
-
3
-
4
-
5
-
6
-
7
-
8
-
9
-
10
-
11
-
12
-
13
-
14
-
15
-
16
-
17
-
18
-
19
-
20
-
21
-
22
-
23
-
24
-
25
-
26
-
27
-
28
-
29
-
30
-
31
-
32
-
 33
33 -
 34
34 -
 35
35 -
 36
36 -
 37
37 -
 38
38 -
 39
39 -
 40
40 -
 41
41 -
 42
42 -
 43
43 -
 44
44 -
 45
45 -
 46
46 -
 47
47 -
 48
48 -
 49
49 -
 50
50 -
 51
51 -
 52
52 -
 53
53 -
54
-
55
-
56
-
57
-
58
-
59
-
60
 |
 |

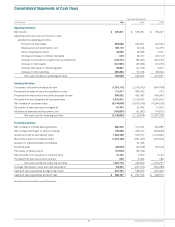
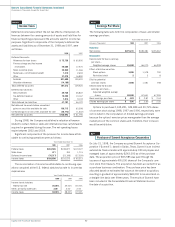
Year Ended December 31
(In Thousands) 1998 1997 1996
Operating Activities:
Net income $ 275,231 $ 189,381 $ 155,267
Adjustments to reconcile net income to cash
provided by operating activities:
Provision for loan losses 267,028 262,837 167,246
Depreciation and amortization, net 108,173 72,674 61,235
Stock compensation plans 70,056 24,878 7,921
(Increase) decrease in interest receivable (141) 26,707 (23,017)
Increase in accounts receivable from securitizations (133,771) (86,261) (143,141)
Increase in other assets (121,951) (49,964) (31,379)
Increase (decrease) in interest payable 22,667 (11,914) 6,431
Increase in other liabilities 293,266 97,914 89,964
Net cash provided by operating activities 780,558 526,252 290,527
Investing Activities:
Purchases of securities available for sale (1,251,713) (1,275,900) (947,478)
Proceeds from sales of securities available for sale 112,277 483,592 773
Proceeds from maturities of securities available for sale 606,532 450,787 490,040
Proceeds from securitizations of consumer loans 4,616,972 2,114,695 2,695,000
Net increase in consumer loans (6,144,640) (2,875,908) (4,264,026)
Recoveries of loans previously charged off 67,764 27,462 13,300
Additions of premises and equipment, net (153,024) (51,602) (74,871)
Net cash used for investing activities (2,145,832) (1,126,874) (2,087,262)
Financing Activities:
Net increase in interest-bearing deposits 686,325 370,632 246,985
Net increase (decrease) in other borrowings 735,288 265,129 (278,820)
Issuances of senior and deposit notes 1,323,700 529,977 2,105,864
Maturities of senior and deposit notes (1,218,162) (891,436) (603,500)
Issuance of preferred beneficial interests 97,428
Dividends paid (20,533) (20,638) (20,573)
Purchases of treasury stock (91,672) (52,314)
Net proceeds from issuances of common stock 12,143 6,509 3,109
Proceeds from exercise of stock options 629 4,082 186
Net cash provided by financing activities 1,427,718 309,369 1,453,251
Increase (decrease) in cash and cash equivalents 62,444 (291,253) (343,484)
Cash and cash equivalents at beginning of year 237,723 528,976 872,460
Cash and cash equivalents at end of year $ 300,167 $ 237,723 $ 528,976
See Notes to Consolidated Financial Statements.
41 Capital One Financial Corporation
Consolidated Statements of Cash Flows