Capital One 1998 Annual Report Download - page 25
Download and view the complete annual report
Please find page 25 of the 1998 Capital One annual report below. You can navigate through the pages in the report by either clicking on the pages listed below, or by using the keyword search tool below to find specific information within the annual report.-
 1
1 -
2
-
3
-
4
-
5
-
6
-
7
-
8
-
9
-
10
-
11
-
12
-
13
-
14
-
 15
15 -
 16
16 -
 17
17 -
 18
18 -
 19
19 -
 20
20 -
 21
21 -
 22
22 -
 23
23 -
 24
24 -
 25
25 -
 26
26 -
 27
27 -
 28
28 -
 29
29 -
 30
30 -
 31
31 -
 32
32 -
 33
33 -
 34
34 -
 35
35 -
36
-
37
-
38
-
39
-
40
-
41
-
42
-
43
-
44
-
45
-
46
-
47
-
48
-
49
-
50
-
51
-
52
-
53
-
54
-
55
-
56
-
57
-
58
-
59
-
60
 |
 |

23 Capital One Financial Corporation
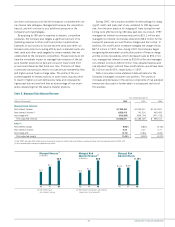
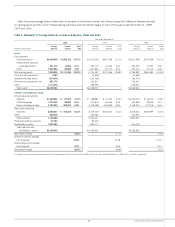
Table 4: Statements of Average Balances, Income and Expense, Yields and Rates
Year Ended December 31
1998 1997 1996
Average Income / Yield / Average Income/ Yield/ Average Income/ Yield/
(Dollars in Thousands) Balance Expense Rate Balance Expense Rate Balance Expense Rate
Assets:
Earning assets
Consumer loans(1) $5,348,559 $1,003,122 18.75% $4,103,036 $619,785 15.11% $3,651,908 $592,088 16.21%
Federal funds sold and
resale agreements 231,312 12,564 5.43 293,119 16,423 5.60 394,939 21,293 5.39
Other 1,645,964 95,850 5.82 1,357,842 81,777 6.02 752,140 47,102 6.26
Total earning assets 7,225,835 $1,111,536 15.38% 5,753,997 $717,985 12.48% 4,798,987 $660,483 13.76%
Cash and due from banks 4,385 (2,636) 40,698
Allowance for loan losses (214,333) (132,728) (83,573)
Premises and equipment, net 201,173 181,610 156,441
Other 1,113,372 768,694 656,407
Total assets $8,330,432 $6,568,937 $5,568,960
Liabilities and Stockholders’ Equity:
Interest-bearing liabilities
Deposits $1,430,042 $ 67,479 4.72% $ 958,885 $ 41,932 4.37% $1,046,122 $ 56,272 5.38%
Other borrowings 1,376,156 88,600 6.44 631,876 39,066 6.18 454,899 28,509 6.27
Senior and deposit notes 3,787,639 260,675 6.88 3,718,988 253,849 6.83 3,168,205 210,218 6.64
Total interest-bearing
liabilities 6,593,837 $ 416,754 6.32% 5,309,749 $334,847 6.31% 4,669,226 $294,999 6.32%
Other 550,819 345,582 222,975
Total liabilities 7,144,656 5,655,331 4,892,201
Preferred beneficial interests 97,793 89,529
Stockholders’ equity 1,087,983 824,077 676,759
Total liabilities and
stockholders’ equity $8,330,432 $6,568,937 $5,568,960
Net interest spread 9.06% 6.17% 7.44%
Interest income to average
earning assets 15.38 12.48 13.76
Interest expense to average
earning assets 5.76 5.82 6.14
Net interest margin 9.62% 6.66% 7.62%
(1) Interest income includes past-due fees on loans of approximately $301,979, $132,297 and $94,393 for the years ended December 31, 1998, 1997 and 1996, respectively.
Table 4 provides average balance sheet data, an analysis of net interest income, net interest spread (the difference between the yield
on earning assets and the cost of interest-bearing liabilities) and net interest margin for each of the years ended December 31, 1998,
1997 and 1996.