Capital One 1998 Annual Report Download - page 22
Download and view the complete annual report
Please find page 22 of the 1998 Capital One annual report below. You can navigate through the pages in the report by either clicking on the pages listed below, or by using the keyword search tool below to find specific information within the annual report.-
 1
1 -
2
-
3
-
4
-
5
-
6
-
7
-
8
-
9
-
10
-
11
-
 12
12 -
 13
13 -
 14
14 -
 15
15 -
 16
16 -
 17
17 -
 18
18 -
 19
19 -
 20
20 -
 21
21 -
 22
22 -
 23
23 -
 24
24 -
 25
25 -
 26
26 -
 27
27 -
 28
28 -
 29
29 -
 30
30 -
 31
31 -
 32
32 -
33
-
34
-
35
-
36
-
37
-
38
-
39
-
40
-
41
-
42
-
43
-
44
-
45
-
46
-
47
-
48
-
49
-
50
-
51
-
52
-
53
-
54
-
55
-
56
-
57
-
58
-
59
-
60
 |
 |
20Capital One Financial Corporation
Management’s Discussion and Analysis of Financial Condition and Results of Operations (continued)
paid in full. During the accumulation period, the investors’ share of
principal payments is paid into a principal funding account
designed to accumulate amounts so that the certificates can be
paid in full on the expected final payment date.
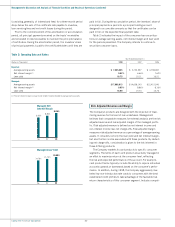
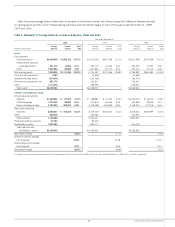
Table 2 indicates the impact of the consumer loan securitiza-
tions on average earning assets, net interest margin and loan yield
for the periods presented. The Company intends to continue to
securitize consumer loans.
(consisting, generally, of interest and fees) for a three-month period
drops below the sum of the certificate rate payable to investors,
loan servicing fees and net credit losses during the period.
Prior to the commencement of the amortization or accumulation
period, all principal payments received on the trusts’ receivables
are reinvested in new receivables to maintain the principle balance
of certificates. During the amortization period, the investors’ share
of principal payments is paid to the certificateholders until they are
Table 2: Operating Data and Ratios
Year Ended December 31
(Dollars in Thousands) 1998 1997 1996
Reported:
Average earning assets $ 7,225,835 $ 5,753,997 $ 4,798,987
Net interest margin(1) 9.62% 6.66% 7.62%
Loan yield 18.75 15.11 16.21
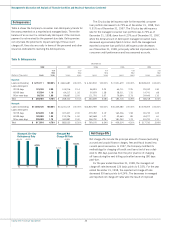
Managed:
Average earning assets $17,086,813 $14,658,143 $12,415,540
Net interest margin(1) 9.95% 8.86% 8.16%
Loan yield 16.99 15.73 14.76
(1) The net interest margin is equal to net interest income divided by average earning assets.
Risk Adjusted Revenue and Margin
The Company’s products are designed with the objective of maxi-
mizing revenue for the level of risk undertaken. Management
believes that comparable measures for external analysis are the risk
adjusted revenue and risk adjusted margin of the managed portfo-
lio. Risk adjusted revenue is defined as net interest income and
non-interest income less net charge-offs. Risk adjusted margin
measures risk adjusted revenue as a percentage of average earning
assets. It considers not only the loan yield and net interest margin,
but also the fee income associated with these products. By deduct-
ing net charge-offs, consideration is given to the risk inherent in
these differing products.
The Company markets its card products to specific consumer
segments. The terms of each card product are actively managed in
an effort to maximize return at the consumer level, reflecting
the risk and expected performance of the account. For example,
card product terms typically include the ability to reprice individual
accounts upwards or downwards based on the consumer’s perfor-
mance. In addition, during 1998, the Company aggressively mar-
keted low non-introductory rate cards to consumers with the best
established credit profiles to take advantage of the favorable risk
return characteristics of this consumer segment. Industry competi-
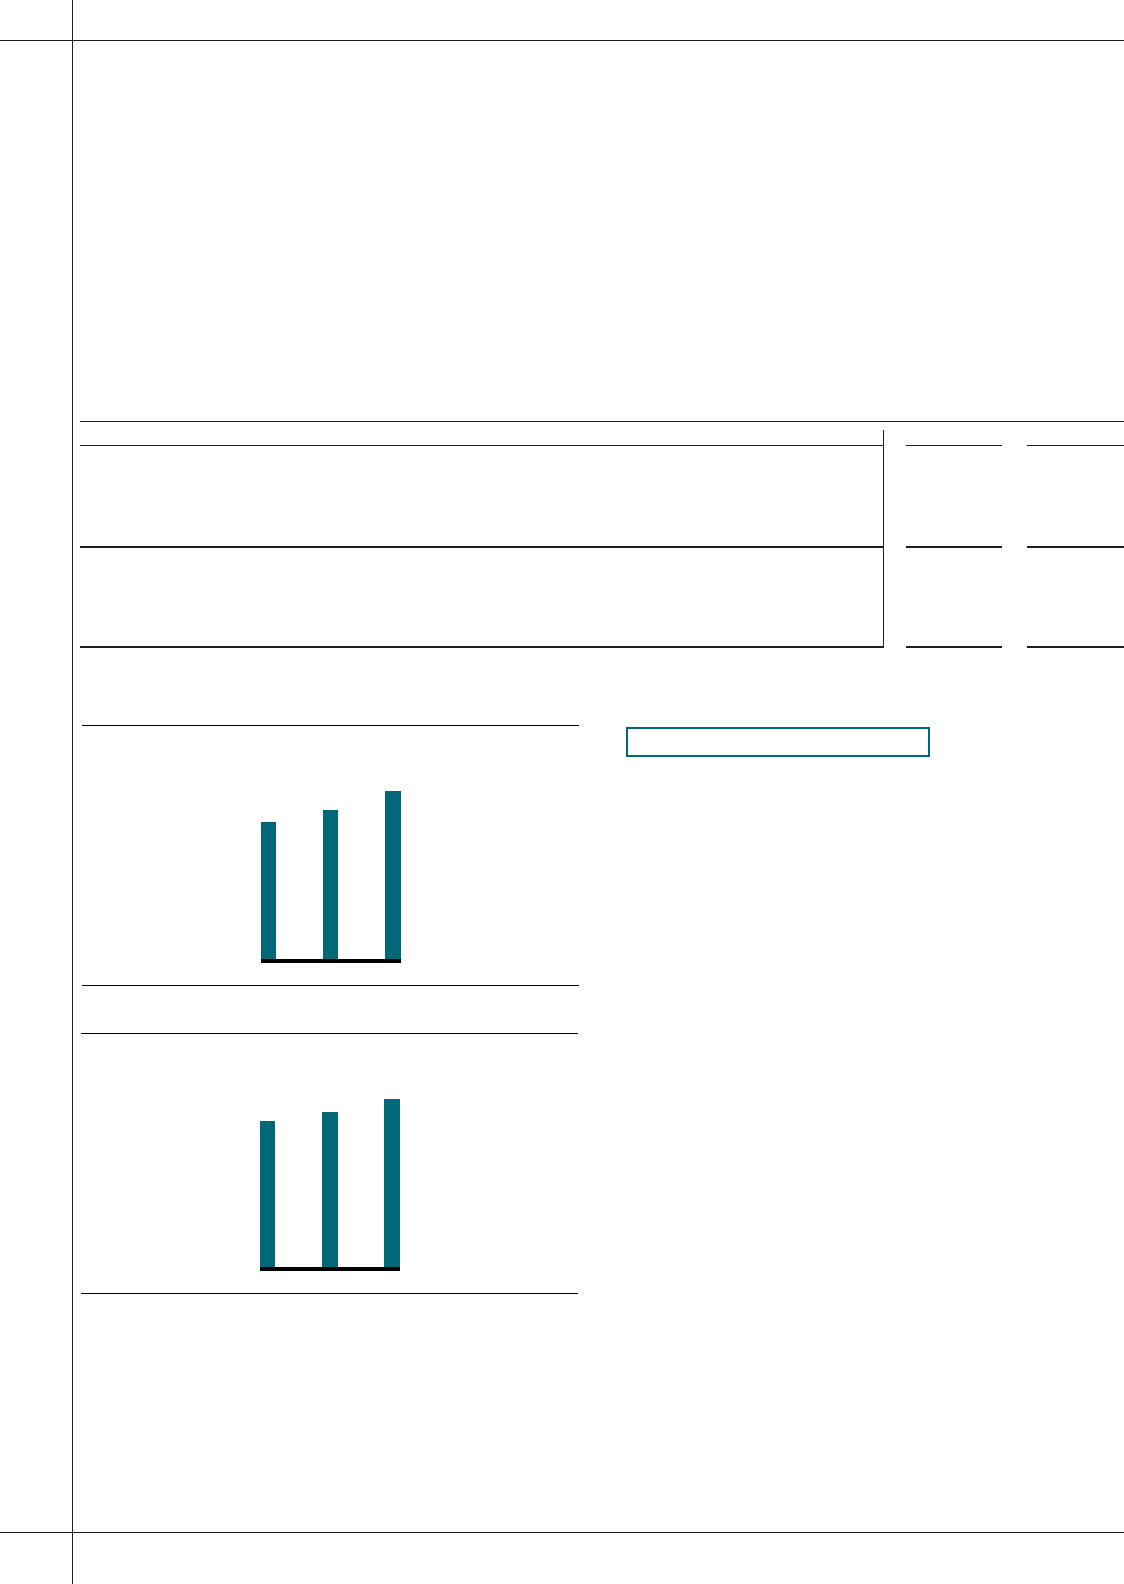
9.95%
8.86%
8.16%
Managed Net
Interest Margin
96 97 98
16.99%
15.73%
14.76%
Managed Loan Yield
96 97 98