CVS 2012 Annual Report Download - page 88
Download and view the complete annual report
Please find page 88 of the 2012 CVS annual report below. You can navigate through the pages in the report by either clicking on the pages listed below, or by using the keyword search tool below to find specific information within the annual report.-
 1
1 -
2
-
3
-
4
-
5
-
6
-
7
-
8
-
9
-
10
-
11
-
12
-
13
-
14
-
15
-
16
-
17
-
18
-
19
-
20
-
21
-
22
-
23
-
24
-
25
-
26
-
27
-
28
-
29
-
30
-
31
-
32
-
33
-
34
-
35
-
36
-
37
-
38
-
39
-
40
-
41
-
42
-
43
-
44
-
45
-
46
-
47
-
48
-
49
-
50
-
51
-
52
-
53
-
54
-
55
-
56
-
57
-
58
-
59
-
60
-
61
-
62
-
63
-
64
-
65
-
66
-
67
-
68
-
69
-
70
-
71
-
72
-
73
-
74
-
75
-
76
-
77
-
 78
78 -
 79
79 -
 80
80 -
 81
81 -
 82
82 -
 83
83 -
 84
84 -
 85
85 -
 86
86 -
 87
87 -
 88
88 -
 89
89 -
 90
90 -
 91
91 -
 92
92
 |
 |
CVS CAREMARK 2012 ANNUAL REPORT
86
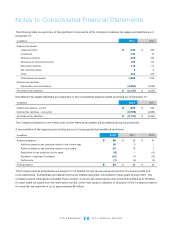
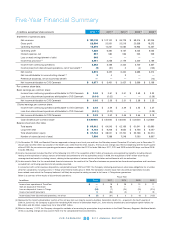
Five-Year Financial Summary
In millions, except per share amounts 2012 (1) (5) 2011 (1) 2010 (1) 2009 (1) 2008 (1)
Statement of operations data:
Net revenues $ 123,133 $ 107,100 $ 95,778 $ 98,215 $ 87,005
Gross profit
22,506 20,561 20,219 20,358 18,272
Operating expenses 15,278 14,231 14,082 13,933 12,237
Operating profit 7,228 6,330 6,137 6,425 6,035
Interest expense, net 557 584 536 525 509
Loss on early extinguishment of debt 348 — — — —
Income tax provision
(2)
2,441 2,258 2,179 2,200 2,189
Income from continuing operations 3,882 3,488 3,422 3,700 3,337
Income (loss) from discontinued operations, net of tax benefit
(3)
(7) (31) 2 (4) (125)
Net income 3,875 3,457 3,424 3,696 3,212
Net loss attributable to noncontrolling interest
(4)
2 4 3 — —
Preference dividends, net of income tax benefit — — — — (14)
Net income attributable to CVS Caremark $ 3,877 $ 3,461 $ 3,427 $ 3,696 $ 3,198
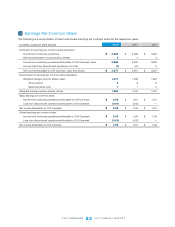
Per common share data:
Basic earnings per common share:
Income from continuing operations attributable to CVS Caremark $ 3.06 $ 2.61 $ 2.51 $ 2.58 $ 2.32
Loss from discontinued operations attributable to CVS Caremark (0.01) (0.02) — — (0.09)
Net income attributable to CVS Caremark $ 3.05 $ 2.59 $ 2.51 $ 2.58 $ 2.23
Diluted earnings per common share:
Income from continuing operations attributable to CVS Caremark $ 3.03 $ 2.59 $ 2.49 $ 2.55 $ 2.27
Loss from discontinued operations attributable to CVS Caremark (0.01) (0.02) — — (0.09)
Net income attributable to CVS Caremark $ 3.03 $ 2.57 $ 2.49 $ 2.55 $ 2.18
Cash dividends per common share $ 0.65000 $ 0.50000 $ 0.35000 $ 0.30500 $ 0.25800
Balance sheet and other data:
Total assets $ 65,912 $ 64,543 $ 62,169 $ 61,641 $ 60,960
Long-term debt $ 9,133 $ 9,208 $ 8,652 $ 8,756 $ 8,057
Total shareholders’ equity $ 37,704 $ 38,051 $ 37,700 $ 35,768 $ 34,574
Number of stores (at end of year) 7,508 7,388 7,248 7,095 6,997
(1) On December 23, 2008, our Board of Directors approved a change in our fiscal year-end from the Saturday nearest December 31 of each year to December 31
of each year to better reflect our position in the health care, rather than the retail, industry. The fiscal year change was effective beginning with the fourth quarter
of fiscal 2008. As you review our operating performance, please consider that 2012 includes 366 days, 2011, 2010 and 2009 include 365 days, and fiscal 2008
includes 368 days.
(2) Income tax provision includes the effect of the following: (i) in 2010, the recognition of $47 million of previously unrecognized tax benefits, including interest,
relating to the expiration of various statutes of limitation and settlements with tax authorities and (ii) in 2009, the recognition of $167 million of previously
unrecognized tax benefits, including interest, relating to the expiration of various statutes of limitation and settlements with tax authorities.
(3) As discussed in Note 4 to the consolidated financial statements, the results of the TheraCom business are presented as discontinued operations and have been
excluded from continuing operations for all periods presented.
In connection with certain business dispositions completed between 1991 and 1997, the Company retained guarantees on store lease obligations for a number
of former subsidiaries, including Linens ‘n Things which filed for bankruptcy in 2008. The Company’s income (loss) from discontinued operations includes
lease-related costs which the Company believes it will likely be required to satisfy pursuant to its Linens ‘n Things lease guarantees.
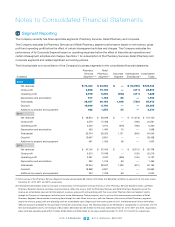
Below is a summary of the results of discontinued operations:
Fiscal Year
In millions 2012 2011 2010 2009 2008
Income from operations of TheraCom $ — $ 18 $ 28 $ 13 $ 11
Gain on disposal of TheraCom — 53 — — —
Loss on disposal of Linens ‘n Things (12) (7) (24) (19) (214)
Income tax benefit (provision) 5 (95) (2) 2 78
Income (loss) from discontinued operations, net of tax $ (7) $ (31) $ 2 $ (4) $ (125)
(4) Represents the minority shareholders’ portion of the net loss from our majority owned subsidiary, Generation Health, Inc., acquired in the fourth quarter of
2009.InJune2012,theCompanyacquiredtheremaining40%interestinGenerationHealth,Inc.fromminorityshareholdersandemployeeoptionholdersfor
$26 million and $5 million, respectively, for a total of $31 million.
(5) Effective January 1, 2012, the Company changed its methods of accounting for prescription drug inventories in the Retail Pharmacy Segment. Additional details
of the accounting change are discussed in Note 2 to the consolidated financial statements.